Arbutus continues to expand the functionality our user community relies on, while optimizing performance and simplifying the user experience. So, what is new in Arbutus Analyzer 6.3? Well, it provides improved data access and discovery and makes it easier for users to create powerful, interactive apps.
Arbutus Analyzer, Server and ConnectPlus users with an active Maintenance & Support can download the latest Arbutus software releases free of charge.
Arbutus Analyzer V6.3, as released in November 2019 includes the enhancements listed below and more.
So, what is new in Analyzer 6.3?
- Expanded data access & discovery
- Increased speed and performance Get more focused, meaningful results with one step – whether reporting in Analyzer or outputting to other reporting and data visualization tools
- Create a more comprehensive suite of customized Arbutus Apps that offer a better, more intuitive user experience
- It’s now even easier to prep and combine data for analysis and visualization

Data access and discovery
Dedicated Import Menu: simplify the growing ways you can explore and access your data with Analyzer.
Prep and combine data for analysis and visualisation
It has now become even easier to prepare and export data for visualition in applications such as Tableau TM, Power BI TM, Qlick TM, etc.
Speed and performance
64 Bit processing where you need it the most – sorting, especially on large files. Our already impressive 32k record width limit has been removed with our new sort command so you can now tackle extremely long record lengths.
Table drilldown
Drilldown has expanded beyond log results. You can now interact with your data output by clicking on a row or cell. Classify, Stratify, Summarize, Age, CrossTab and Benford Analysis.
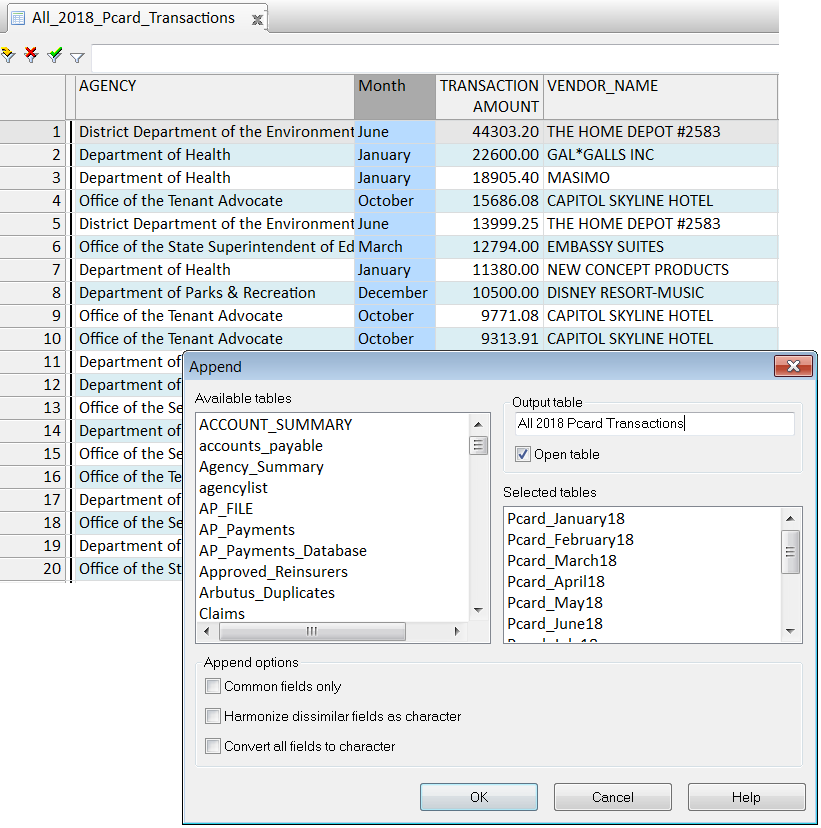
Append command
Easily combine multiple files of the same structure in one step. And unearth new analytics opportunities by using Append to combine disparate data.
Dialogue command
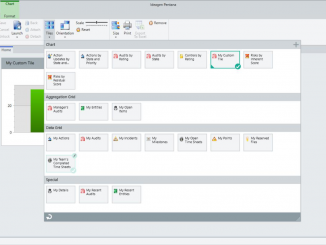
You can now create a more comprehensive suite of customized Arbutus Apps to support users at all levels.
- Edit dynamic dropdown lists
- Unlimited # of controls
- Full 32K fields
- Dropdowns now support multi-select values
Classify command
Customize your output from the powerful Classify command, sort your results descending by size or show only the largest values. Get more focused, meaningful results with one step.

Temporarily suspend queries
Administration of scheduled/centralized analytics is now easier. If you have a need to temporarily suspend an analytic, you no longer need to unscheduled or remove. You can temporarily suspend your query and the most recent password will now automatically be used.
SQL stored procedures
Access and run SQL Stored Procedures throughout the User Interface – Arbutus continues to support SQL as a complimentary way to query your databases.
ODBC drivers for REST
Arbutus additional ODBC Drivers for REST harness the power of cloud-based infrastructure and data sources to maximize the value of your analytics.
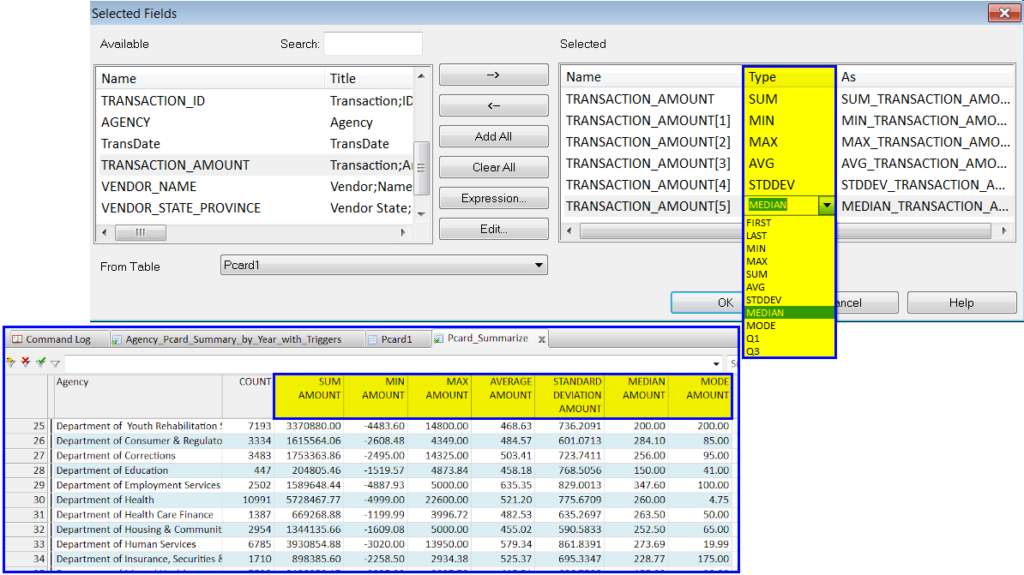
Summarize command
The output options for Summarize now go well beyond totaling/accumulate. Users can now specify 10 other values in their Summarize output greatly expanding the use and value when aggregating data with this powerful command. These expanded output values increase the type of analysis and reporting that can be done within Analyzer and when outputting results to other reporting or data visualization tools.
- First value
- Last value
- Largest value
- Total (same as ACCUMULATE)
- Average
- Standard deviation
- Mode
- Median
- First Quartile
- Third Quartile
Field selection
Drag-and-drop field ordering and the ability to rename output fields (via Arbutus server).
Stratify command
It’s now easier to integrate stratification results into your analytics. Stratify to a data file now explicitly states upper and lower bounds of each range.
Age command
Working with the results from the Arbutus’ built in AGING analysis is now much easier. This expands the type of analysis and reporting that can be done within Analyzer or when outputting results to other reporting or data visualization tools.
Credentials
Simplified administration of your database credentials.
We are here to help!
Sepia Solutions focusses on these GRC tools, so we have all required expertise to assist.