

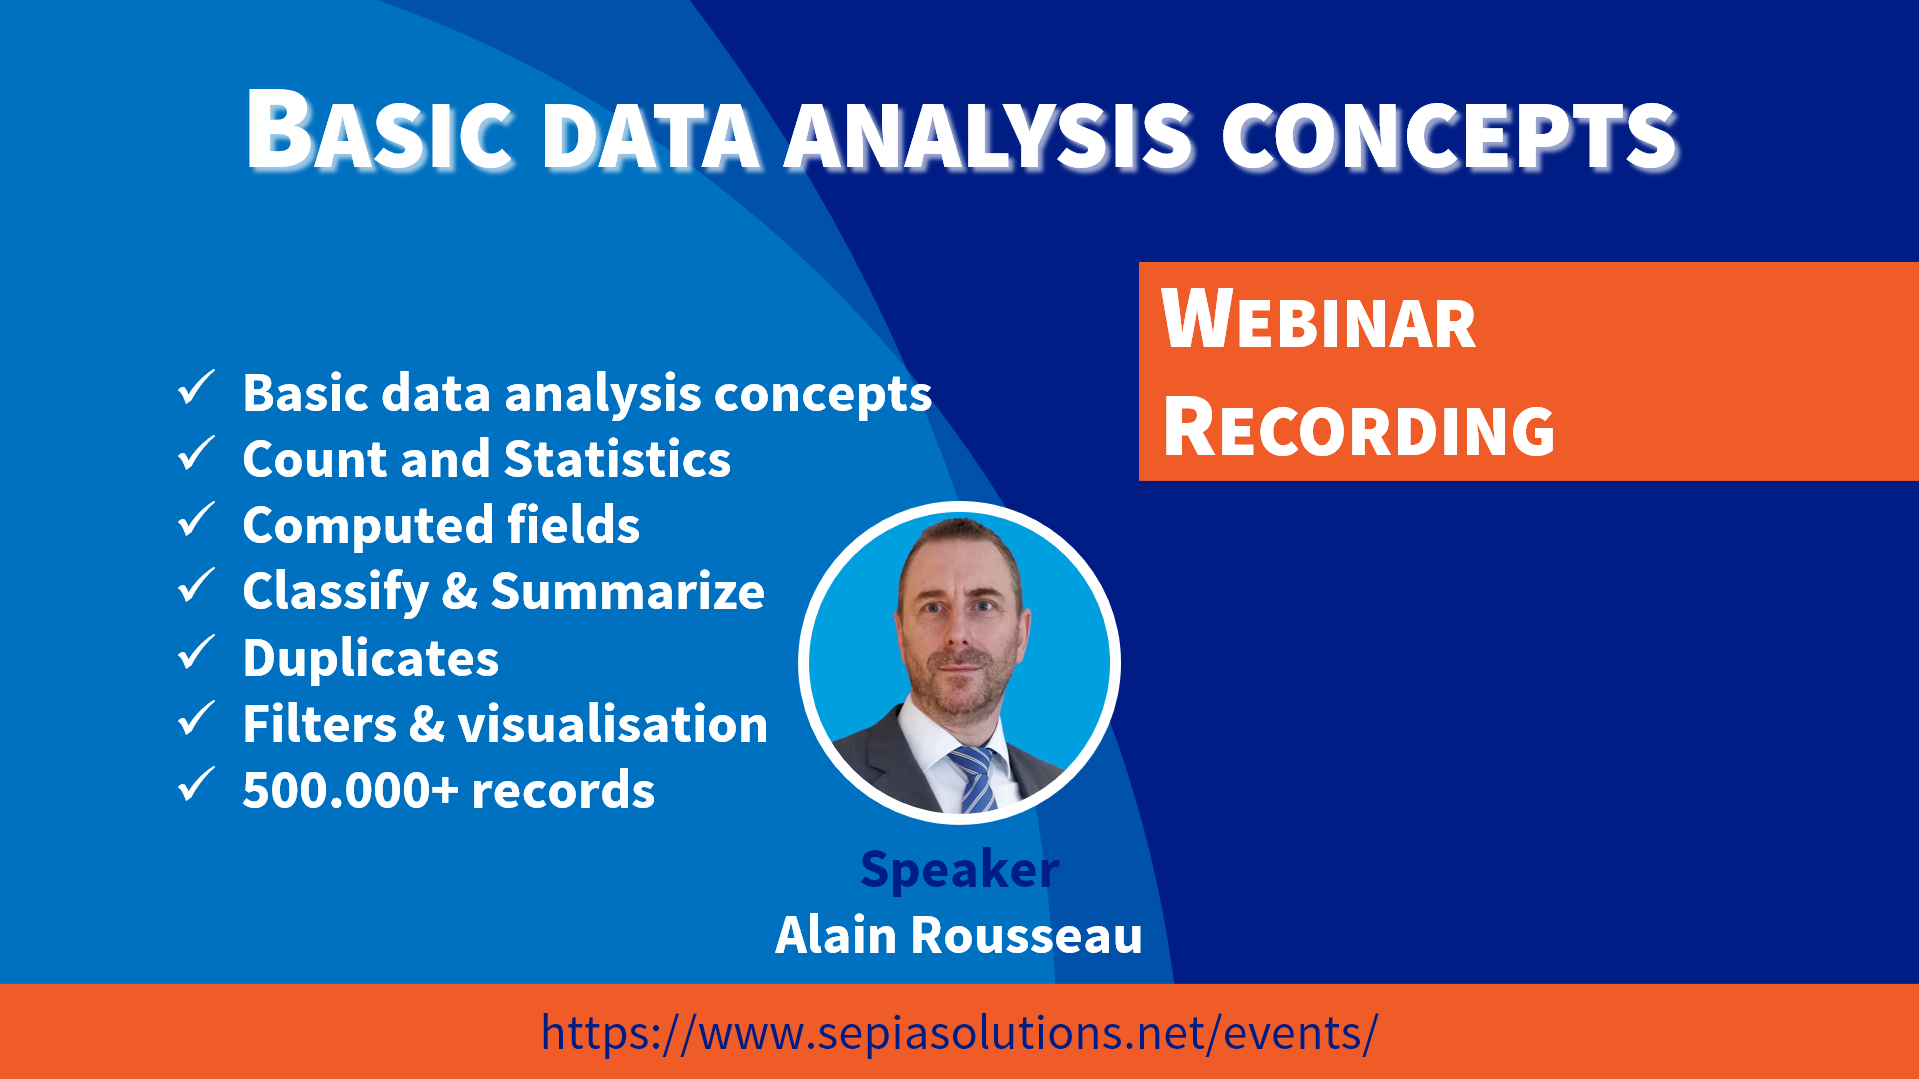
In this webinar recording we illustrate basic data analysis concepts using Arbutus Analyzer and the MS Windows system files.
Starting from a new data set of about 500.000 records available to us all, we create additional fields to compute values based on existing data fields and even add conditions and information to the data using functions.
Next we run some basic data analytics commands such as COUNT, TOTAL and STATISTICS, but also more advanced commands such as CLASSIFY, SUMMARIZE and DUPLICATES.
Based on filters we are able to zoom in on certain records (i.e. identify records of interest) before finishing the webinar with some visualisations.
For this webinar we use a unique data set that is -in a way- available to us all and we can already promise some unexpected results from this simple data analysis!
You can follow this analysis along, or try this out yourself later as we provide the analysis procedure (i.e. executable script) to all attendees.
Watch the full recording …
or dive strating into the chapter of your choice …
Click on the links below to watch the video on the Sepia Solutions Youtube channel starting at that specific section.
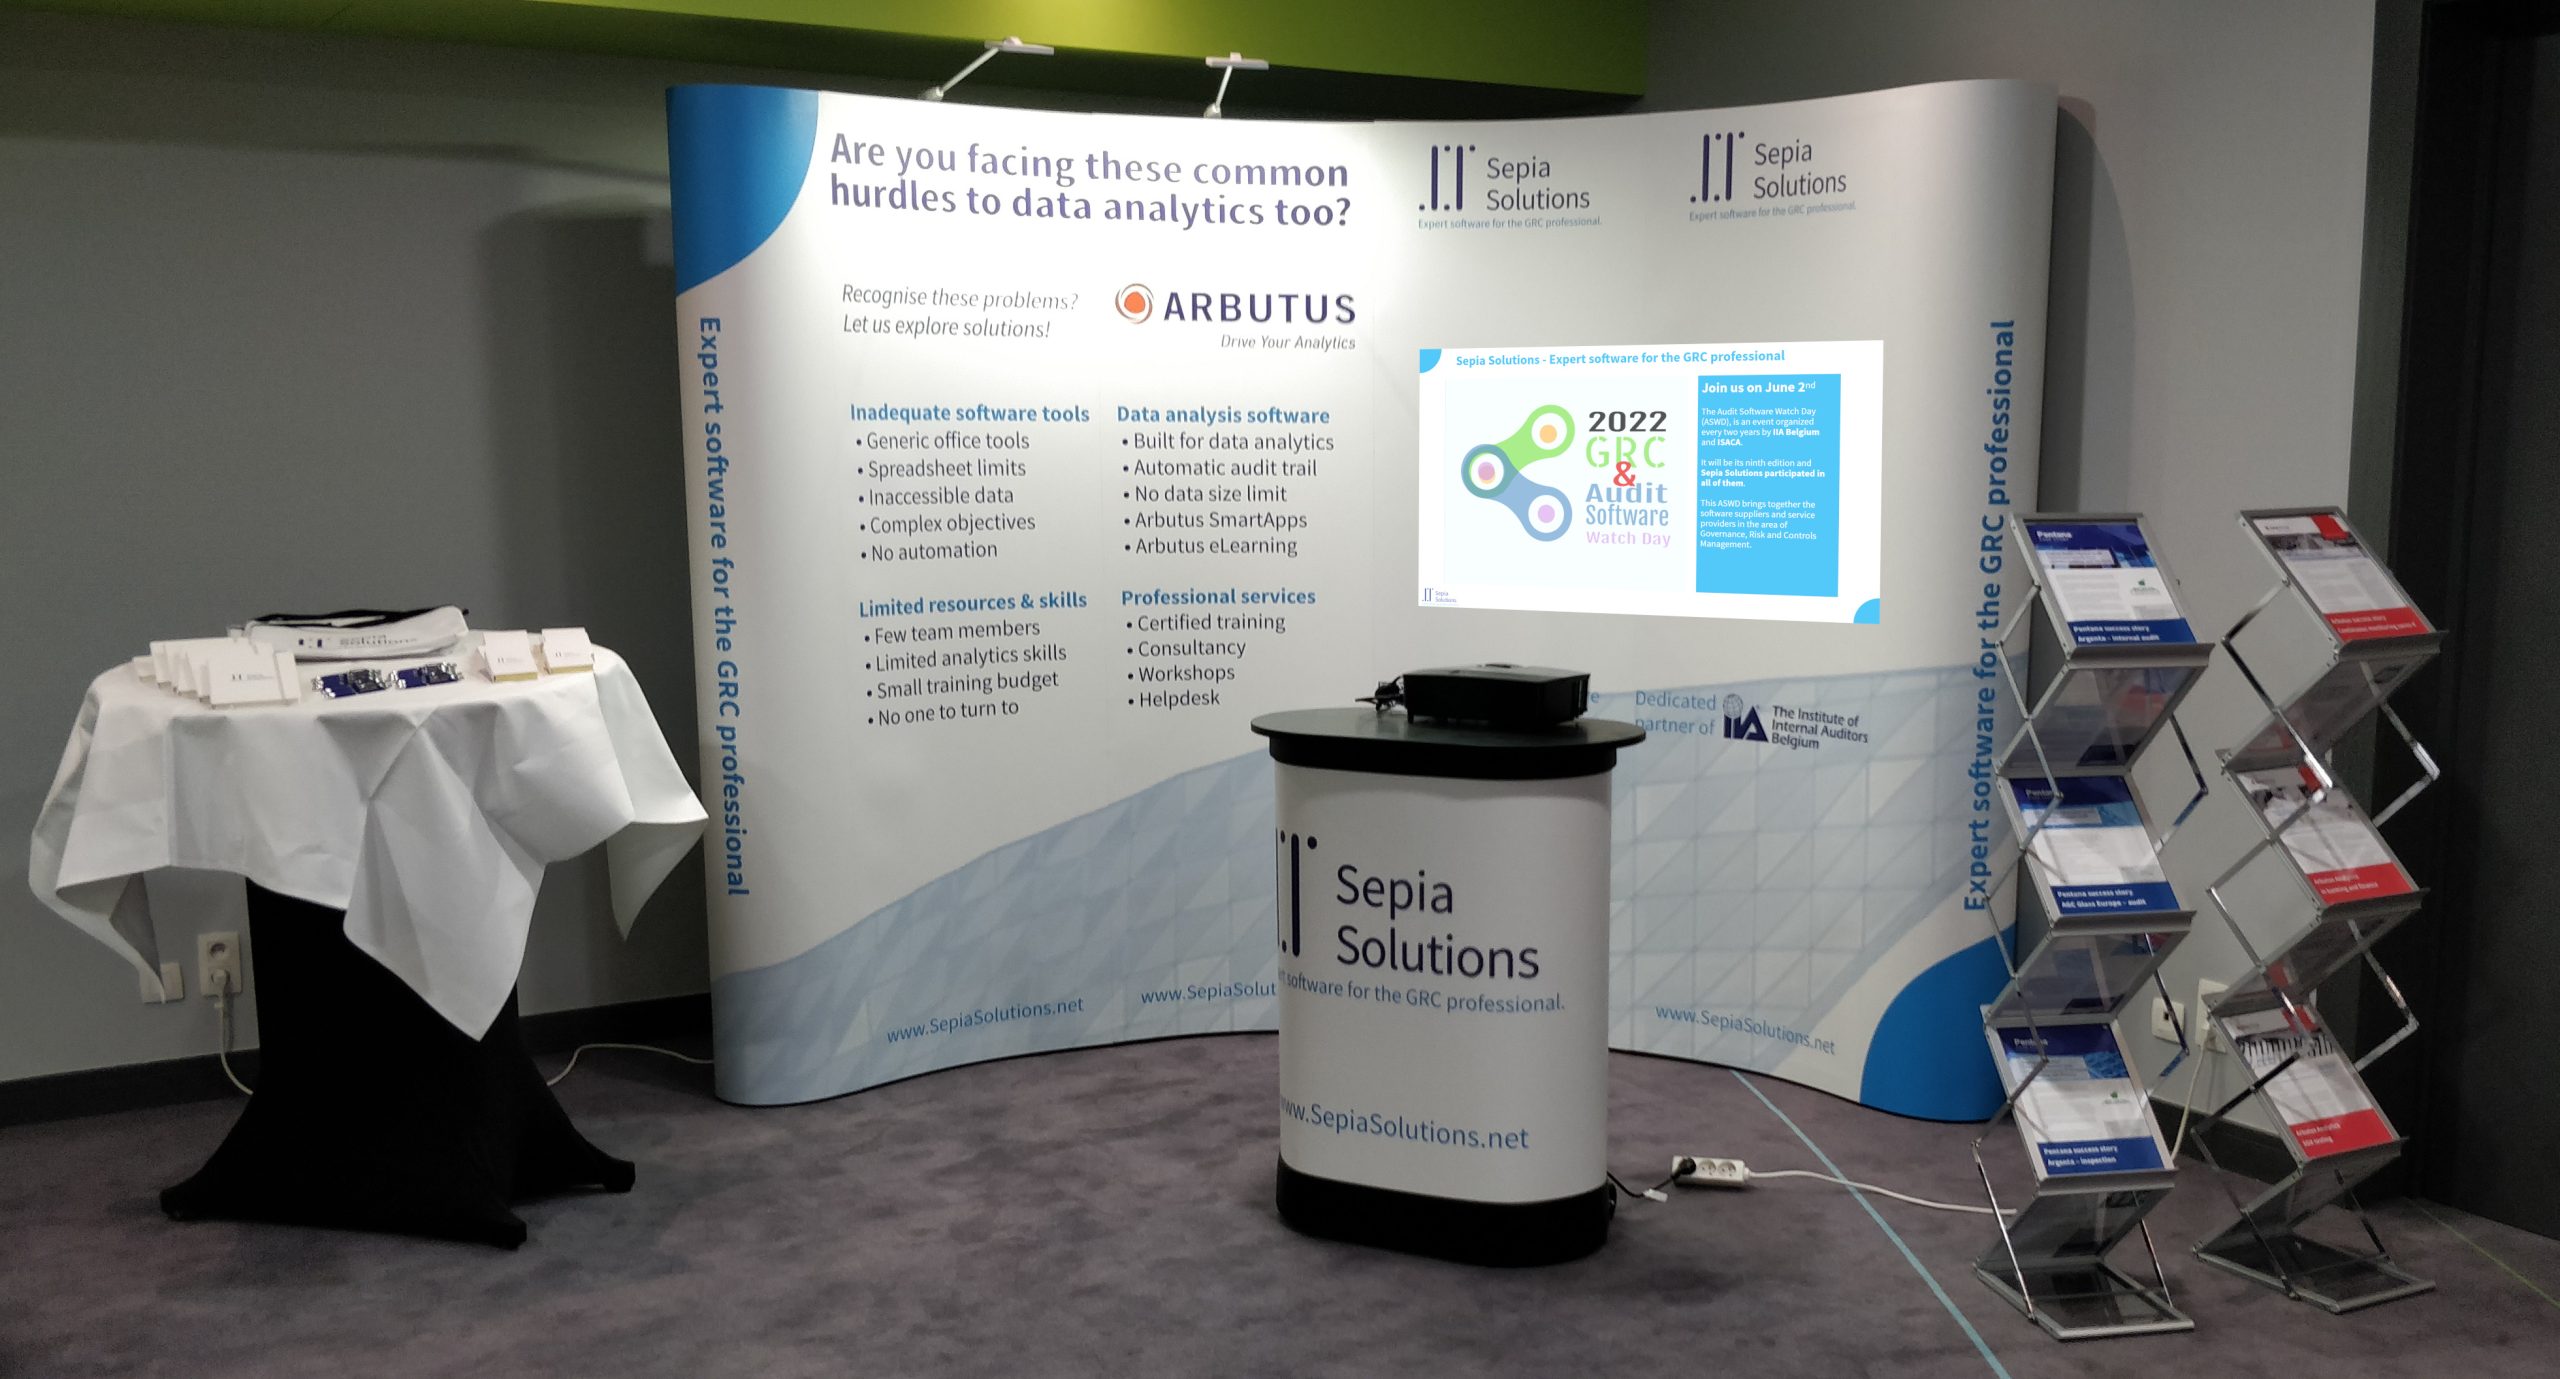
Introductions: About Sepia Solutions
Alain Rousseau opens the webinar by introducting himself and Sepia Solutions. He also explains what he likes most about data analysis projects.
Why use Arbutus Analytics for data analysis?
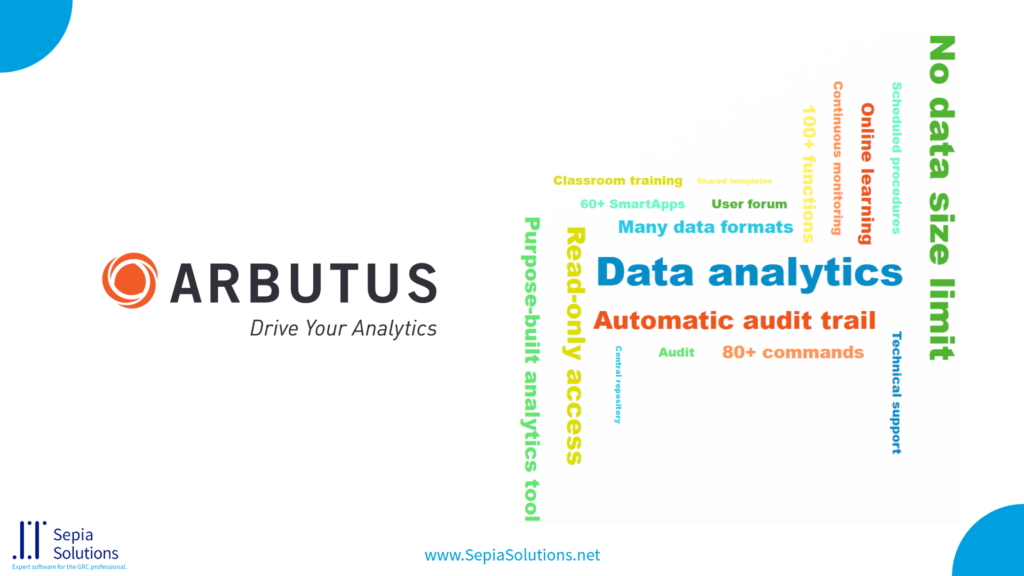
Alain highlights the must-have features for serious data analysis software. Such features include “no data size limit”, “read-only data access”, “audit trail”, etc. Besides the software, additional resources such as training, webinars, events, user groups and support are also important elements to consider when selecting a data analysis tool. Arbutus has all of this covered (and much more besides).
Data access: What data to use?
What data source of data set can we use without breaking confidentiality? All the analyses in this webinar is based on a data file of over 500.000 records that is available to us all.
Should you be interested in evaluating Arbutus Analyzer yourself, just let us know.
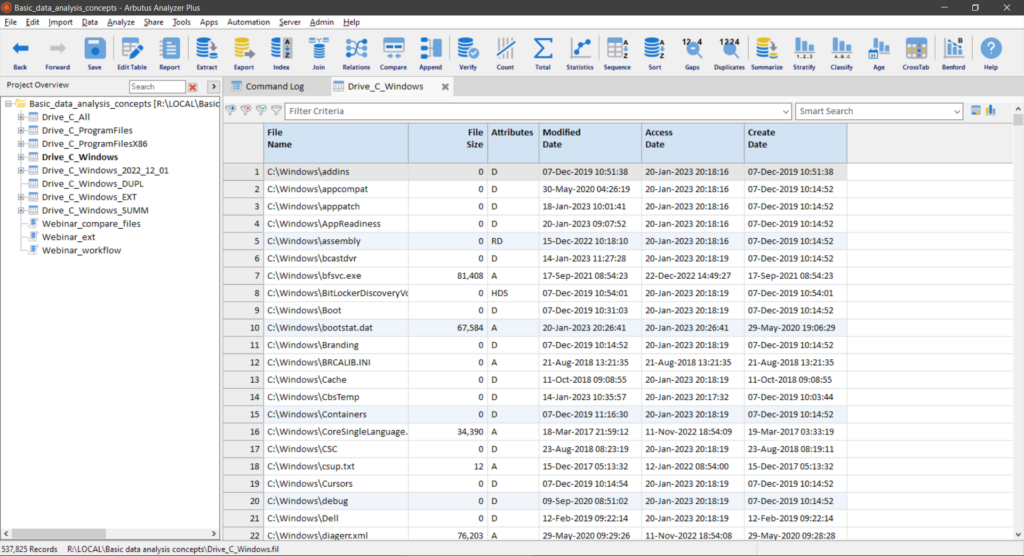
Data access: Data, table, table layout, records, fields
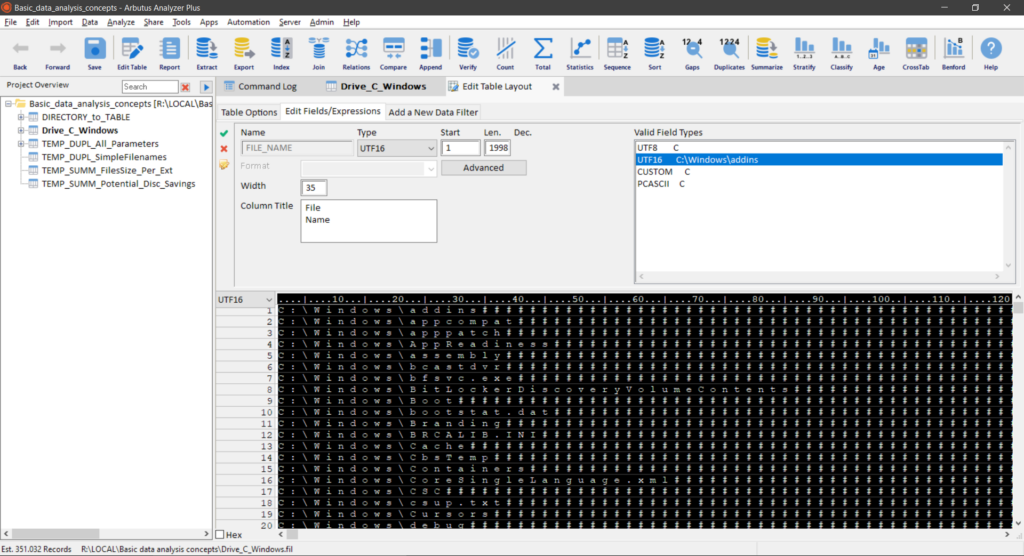
Alain defines the building blocks of data analysis, such as data, table and table layout, records and fields. He also illustrates some details of the fields such as name and type (Character, Numeric, DateTime).
Data analysis: Count, Total, Statistics
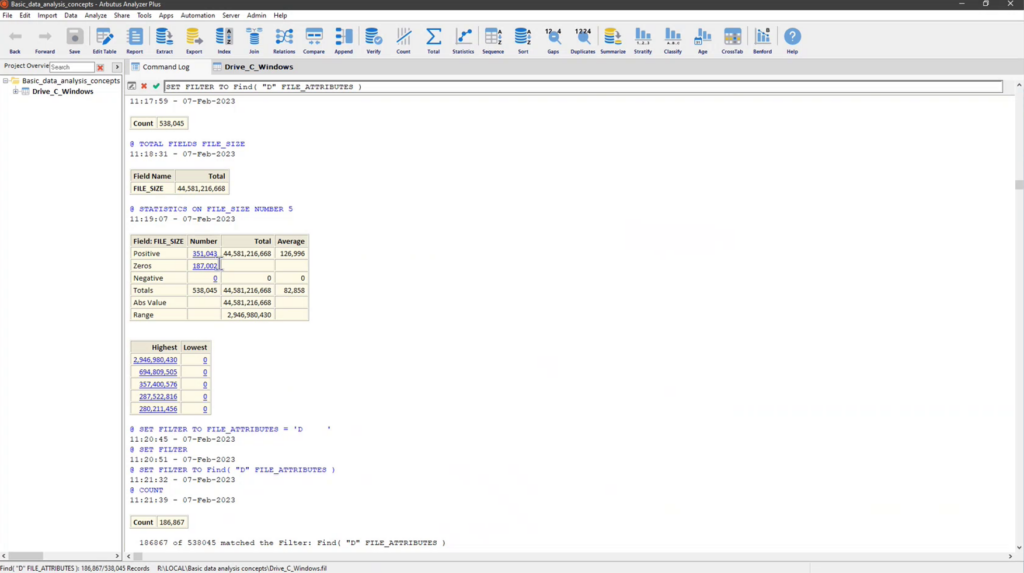
Analyzer supports complex data analytics, but Alain shows the most basic analysis commands such as COUNT, TOTAL, and STATISTICS. All the while, all these commands are written out into the log, as well as the results of those commands.
Also filters (based on functions) are introduced in this chapter.
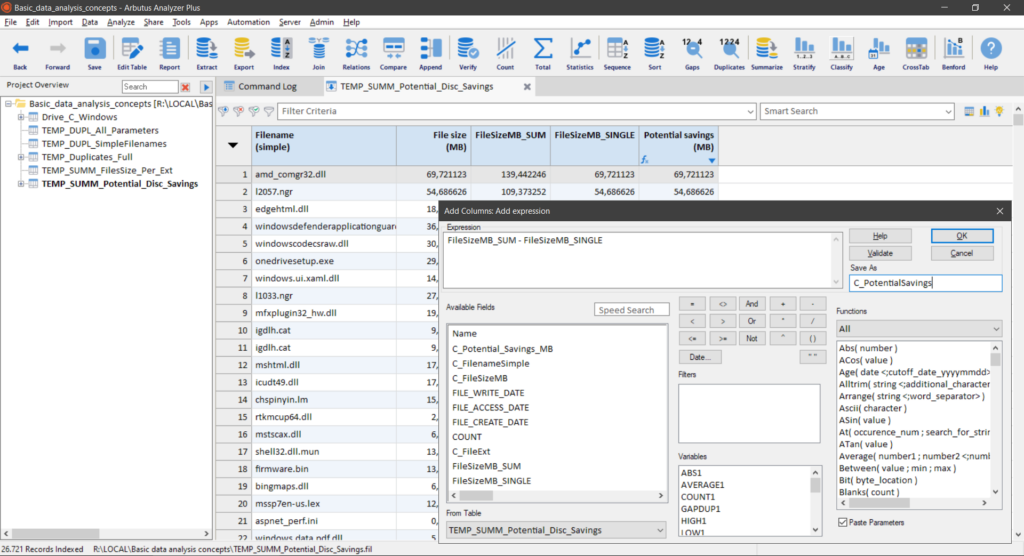
Data analysis: (Conditional) computed fields
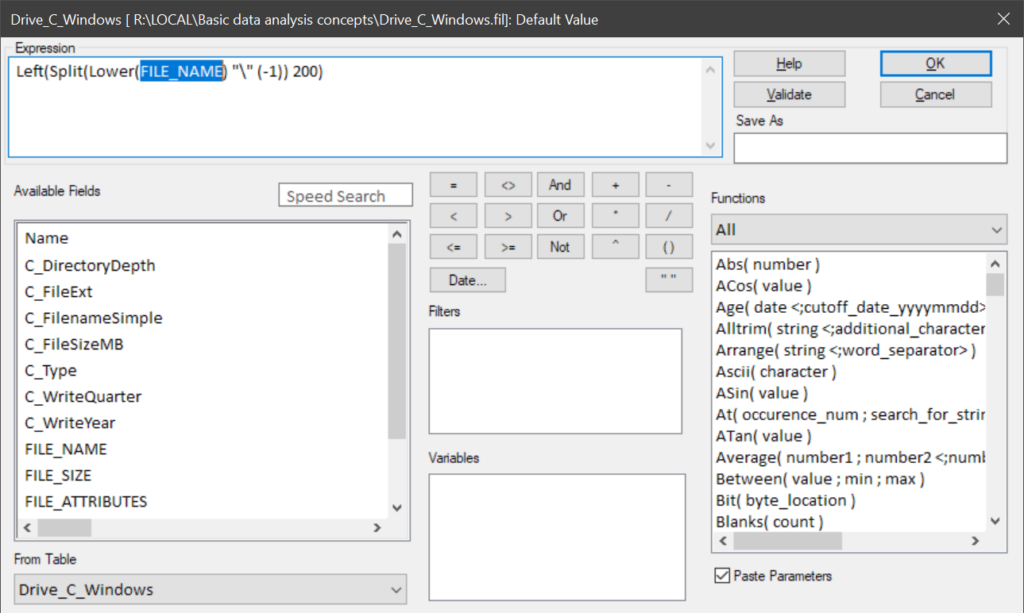
Computed fields, are wonderful as they add they can add information without changing the source data.
The Conditional Computed fields are particularly useful to add business logic or interpretation of the data.
By way of example, Alain creates several computed fields.
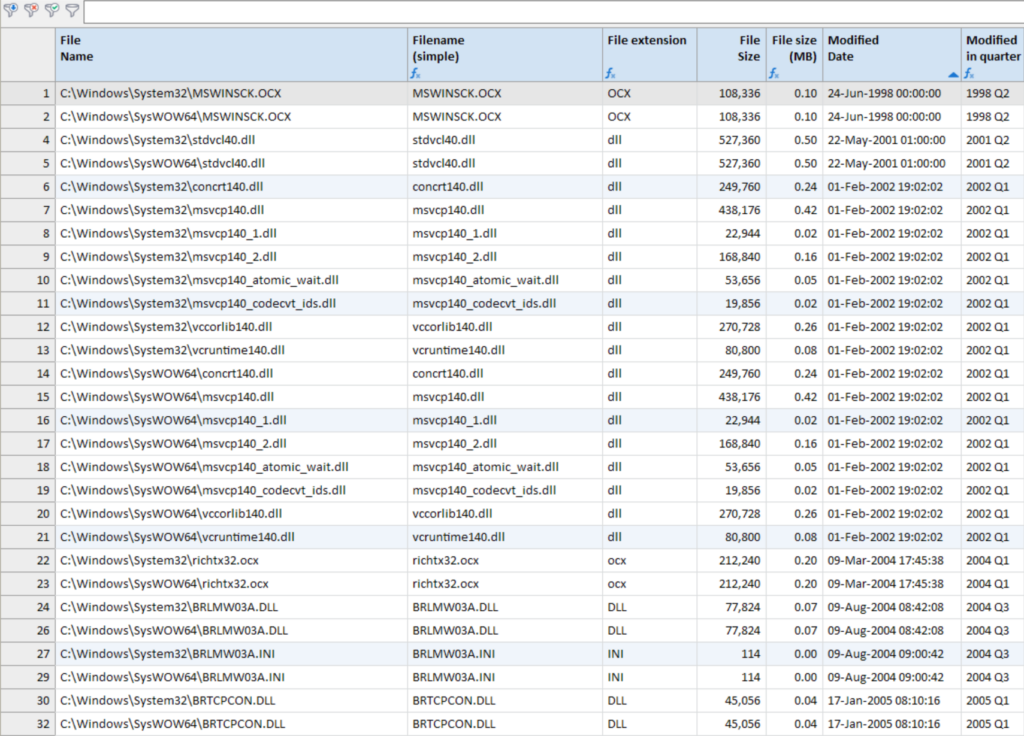
Data analysis: Grouping (Classify, Summarize)
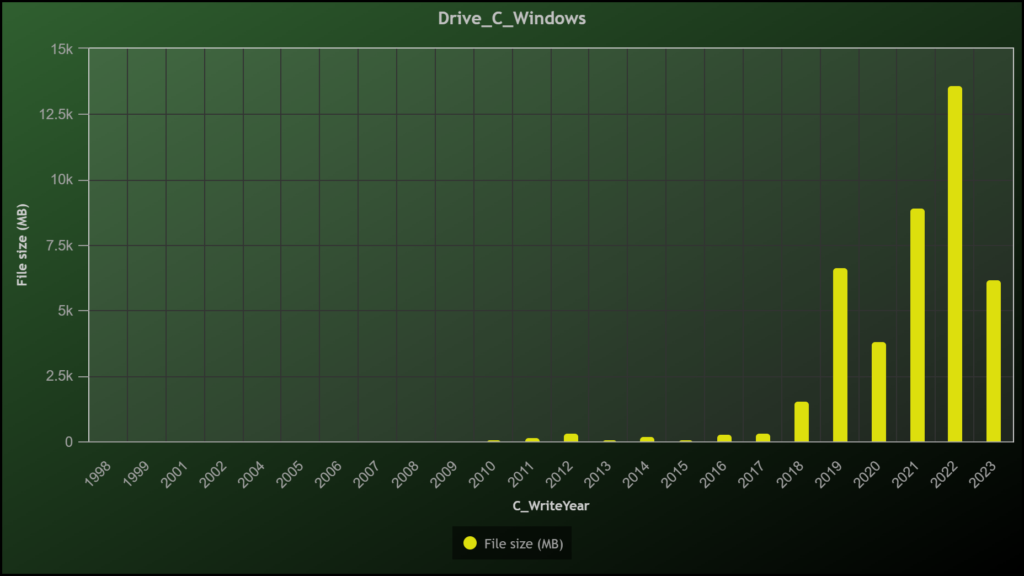
Arbutus provides various ways to group data together. In this case we group all the files together per year in which it was modified and total the file sized in MB.
Note that there are multiple appearances (like skins) for these visualisations and that they are also drill-down; so a double-click takes you right back to the relevant data.
Data analysis: Duplicates

Have you ever wondered how many duplicate files can be found in the C:\Windows file structure?
Using the DUPLICATES command in Analyzer, we analyse the files based on multiple parameters and come to remarkable results.
Data to business insights
Finally, whether you group data, perform a duplicates test, or run various other commands the true value of these analyses lies in the business insights you may gain from them.
Whether it is about reduced turnover, increased margins, or cost savings, this business value is what really matters.
Automation: Repeated analyses
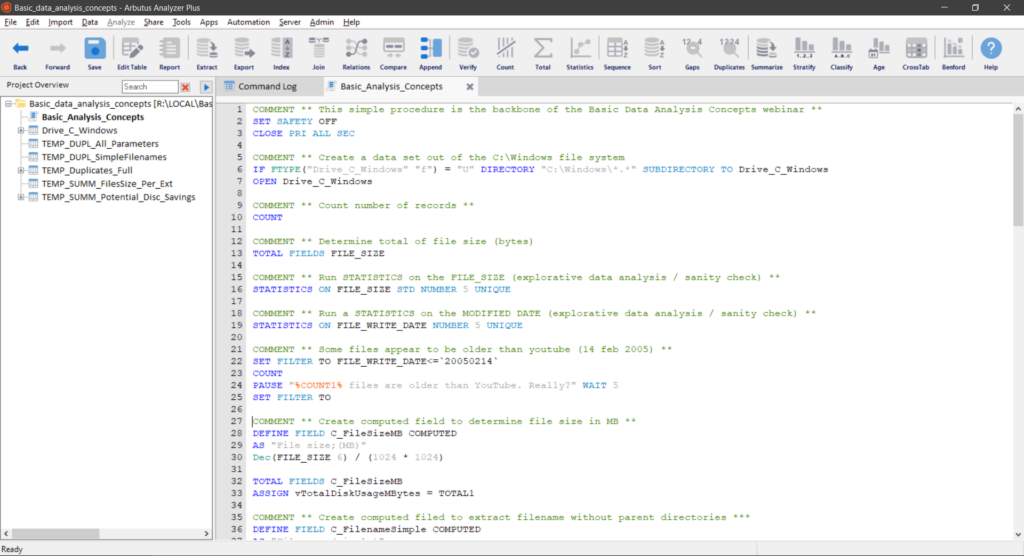
One way of increasting the ROI (Return on Investment) of your analysis work, is to copy the commands from the log into a procedure so that this analysis can be repeated by a push of the button.
You can schedule the procedure to be run automatically. The latter is the road to continuous monitoring.
Wrap-up
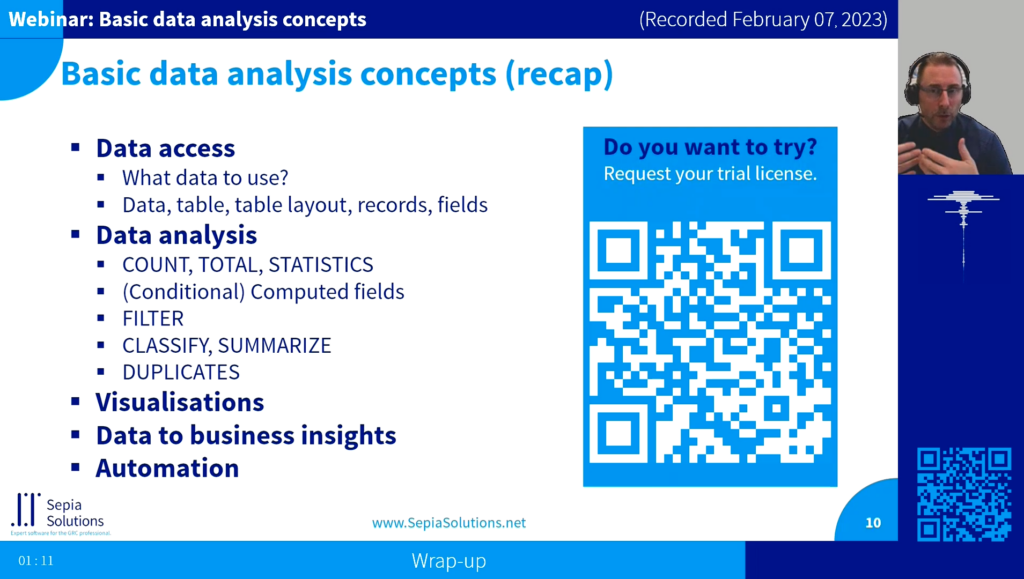
Alain summarizes what we went through in this webinar, from data source and meta data to simple data analysis commands such as COUNT, TOTAL, and STATISTICS. Then proceeded with concepts such as filters and computed fields, grouping commands, a duplicates check and some visuals.
Q&A and closing
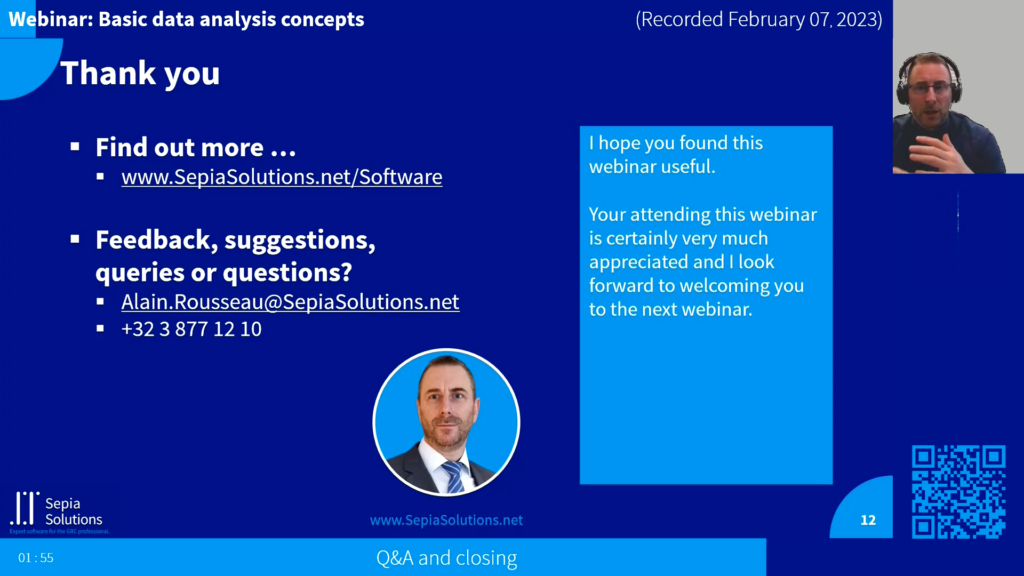
Questions based on this webinar are answered. If you have questions based on the recording, or suggestions for new webinars, simply reach out to us.
Speakers

Alain Rousseau is the driving force behind Sepia Solutions. He has focussed on audit software tools since 2007 and implemented data analysis tools and audit management tools at dozens of organisations in different departments.
With a mixed background of technology and business, Alain is the ideal interface between business users and software developers. His in-depth understanding of both the software and audit profession also makes him an excellent trainer and consultant for these software packages.
You might be interested in other planned events:
-
Audit Software Watch Day 2024
Once again, Sepia Solutions will participate in the Audit Software Watch Day (2024 edition), organised by IIA Bel. […]
You might be interested in more webinar recordings:
-
Continuous Assurance with data analysis

This is a recording of the webinar on Continuous Assurance with data analysis, hosted by Neil Macdonald and Alain Rousseau. […]
-
Basic data analysis concepts
This is a recording of the webinar on basic data analysis concepts, using Arbutus Analyzer. […]
