Arbutus Analytics has posted several videos on Youtube. You can find the collection of these videos on this page, including a short summary or topic. In addition, at the end of this page you can find videos created by others; typically distrubutors of the Arbutus software.
Videos by Arbutus Analytics
Arbutus Analytics for Audit, Fraud, Risk, Compliance & IT professionals.
Analyzer 8.0 – New features
Arbutus 8
Arbutus Software Inc have officially launched a new release of Arbutus, so let’s find out what is new in Arbutus 8.0!
Arbutus 8 was designed to enlist everyone in the growing analytics movement.
- Ensure data quality
- Build complex analytics – easily
- Visualize results & engage your Team.
Extended Profile
Explore and access your data with one click!
Access up to 60 attributes for each field across 6 categories:
Verification, Statistics, Distribution, Date/Time, Outliers and Format.
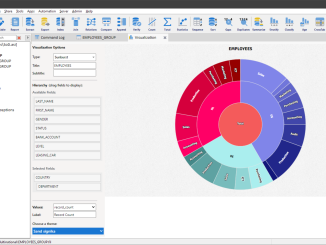
Enhanced Results
Visualise your results quickly and easily
Access visual and tabular results Automatically when running Compare, Classify, Stratify, and Age commands
Improved workflows
Group and zoom
Group your commands into containers to help manage space and performance or to isolate a process.
Expand or collapse, move within your canvas, or disable to help debug or drive more perfomance
More Arbutus 8 features
Data connectors and more
Discover the additional data connectors, graphing options, improved tables selection, enhanced Excel import, ConnectPlus API, etc.
Analyzer 7.0 – New features
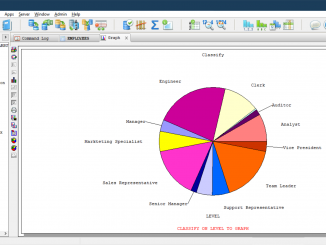
Visualisations
When presenting audit findings, graphs and charts can be effective in highlighting areas of risk and supporting your audit recommendations.
Although tables of data are common within the data analytics community, our audiences may not always be able to interpret them readily.
Choosing the right type of graph can be a quick shortcut to making your point.
Masking sensitive data
Enable data analytics on ALL of your data while ensuring data security.
Mask critical data with the Hash() function.
Maintain your effectiveness and efficiency without compromising confidentiality.
Drag & drop pivot tables
Immerse yourself in your data using powerful, interactive, drag & drop pivot table analytics. –
Get immediate on-screen feedback as results change dynamically based on what you’ve just tried.
The Quick Search feature
The Quick Search feature helps you find Arbutus objects in the Overview and in the project.
This is a big time-saver when working on complex projects containing multiple tables, views, folders, and procedures.
Creating a new Workflow
Workflows are easy to design, build, edit, and debug. Watch this short video demonstrating steps to create a workflow in Analyzer Version7 – The graphic representation of a logical analytic flow is much more intuitive than pages of code, eliminating the need for any programming experience.
If you can understand a flowchart, you can build a workflow.
Your team can quickly grasp the analytics that you have built.
Executing a Workflow
After execution, the workflow can indicate which steps, if any, have failed. This is a useful feature that helps you address any errors.
Arbutus workflows can display the number of records that are processed at each node.
The Data Preview screen can aid you in visually confirming the results of the analytics.
More Arbutus YouTube videos by third parties
Arbutus Analytics
by Beta Software
Learn how Arbutus Analytics can turn your data analytics into tangible business growth.