SoD, or segregation of duties, is a well-known concept. But how do you verify that this concept is indeed properly configured in the CRM system or other tools? In short, how do you identify SoD issues?
In this use case, we go through all the steps to evaluate the SoD configuration.
Using Arbutus Analyzer (a specialised data analysis tool), we illustrate how to identify SoD issues. We take you through all the steps of analysing the permissions as configured for hundreds of users by comparing those with a list of combinations that are not be allowed.
Finally, we create a detailed report that documents those SoD transgressions per user.
As a bonus, we schedule this test on a weekly basis to alert local managers so they can take prompt action; in effect turning the audit effort into an effective continuous monitoring system.
Content
As this is a rather substantial article, we provide this handy little overview with navigable links.
- Introduction
- Data files for the analysis
- The data analysis process
- Next steps: increase ROI (return on investment)
- We can illustrate it so much better!
Introduction
Definition of SoD
Segregation of Duties (SoD) is an internal control to separate duties among more than one individual so that certain tasks or actions need to be performed by more than one person. This internal control is designed to mitigate the risk of fraud, waste and error by requiring that another set of eyes reviews the information and by ensuring a single person cannot perform the process end-to-end without the cooperation of another individual.
Data analysis question
Is our CRM system configured so that it completely enforces the SoD approach, or are users given too much access? Can we identify SoD issues in our systems?
We can look for exceptions against the rules in two ways: preventive and detective.
| Preventive | The permissions or duties of each employee are analysed for conflicts. |
| Detective | Past transactions are analysed to see whether some tasks, that should not have been combined, were performed by a single user. |
In this data analysis use case, we perform the preventive analysis. However, the detective kind of analysis would -broadly speaking- follow the same steps.
Consider the analogy of drinking and driving. In order to avoid accidents, it is not allowed to drive while under influence. So, legislation and campaigns tell people not to combine driving with drinking (preventive). However, detective controls (i.e. being pulled over and taking a test) remains necessary (detective).
What is Arbutus Analyzer?
Arbutus Analyzer is a powerful data access and analysis solution that auditors, business analysts, and fraud investigators use to access and analyse data quickly and simply.
This versatile and purpose-built data analysis tool knows no data size limit, approaches data in a read-only mode and automatically created an audit log by writing all commands and results to a log file.
It can be used as a stand-alone application for analytics or as part of a comprehensive centralized data access and analysis configuration.
Its robust performance and easy to use features give you the shortest route to answers in your data.
Contact us for more details, presentations or trial/evaluation licenses.
Data files for the analysis
We cannot identify SoD issues (i.e. perform the data analysis) without data. So, in order to perform this analysis, we use these files:
- Required files
- User_Duties
- Prohibited_Duty_Combinations
- Reference information
- SAP_TCodes
- User_Accounts
- Regional_Managers
Required files
User_Duties
The table User_Duties includes the Users’ ID and all the duties granted to that user ID. The example data file in this use case contains 42,370 records and an illustration is included below.

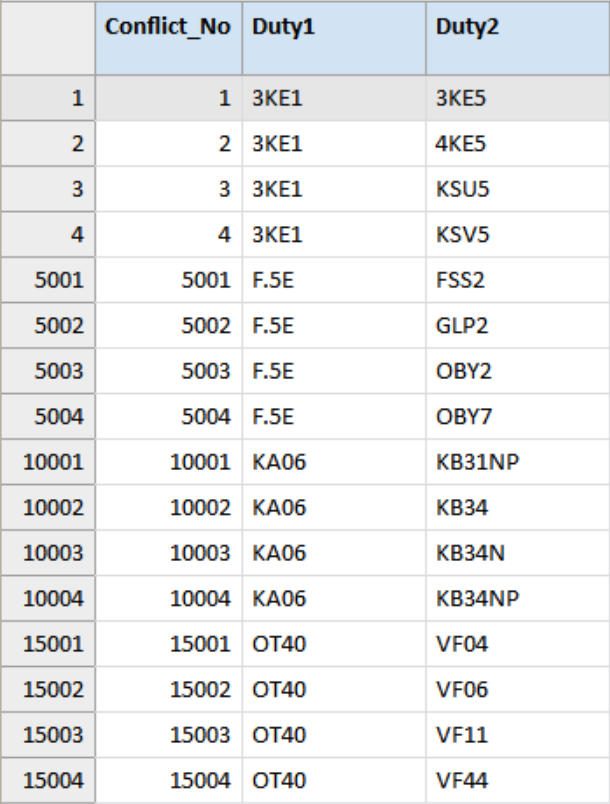
Prohibited_Duty_Combinations
The table Prohibited_Duty_Combinations basically defines these “rules” or rather the restrictions as a list of duties that must not be combined. The data file in this example is used to illustrate the principle of this type of analysis not as an authority on which roles or duties to combine or split. The example data file in this use case contains 18,764 records. We make no guarantee regarding its completeness, accuracy, or even common sense.
The codes used here are based on SAP, but the analysis would be similar for any other system or application.
Optional / reference files
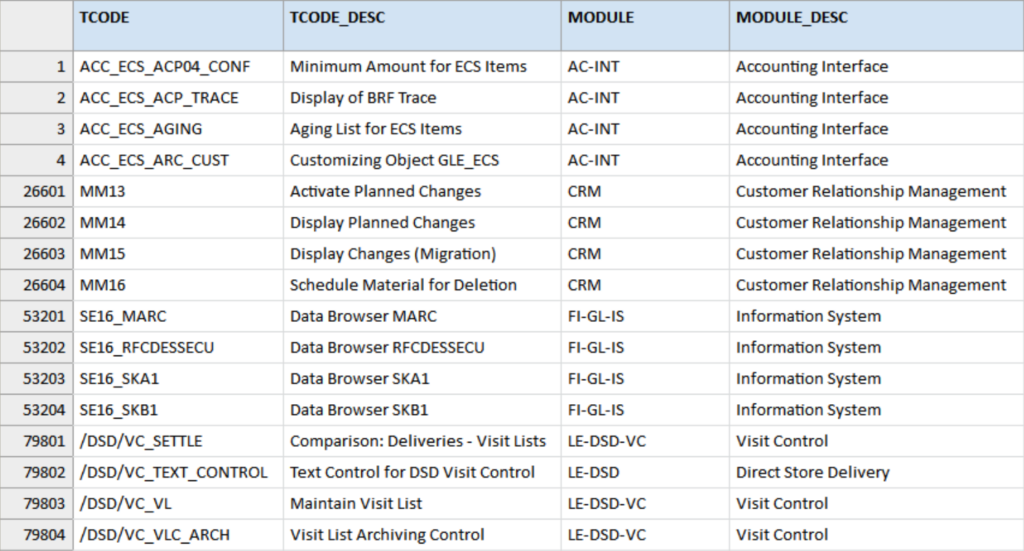
SAP_TCodes
Strictly speaking it is not necessary to understand what each duty or permission code means, though it is nice to better understand the data (or the resulting report).
Therefore, we add this reference or lookup table for the codes. The table SAP_TCodes is based on information found in the Internet, resulting in this example data file that contains 132,995 records.
We make no guarantee regarding its completeness or accuracy. This information will be added to the output report but can just as easily be used to enrich the User_Duties file.
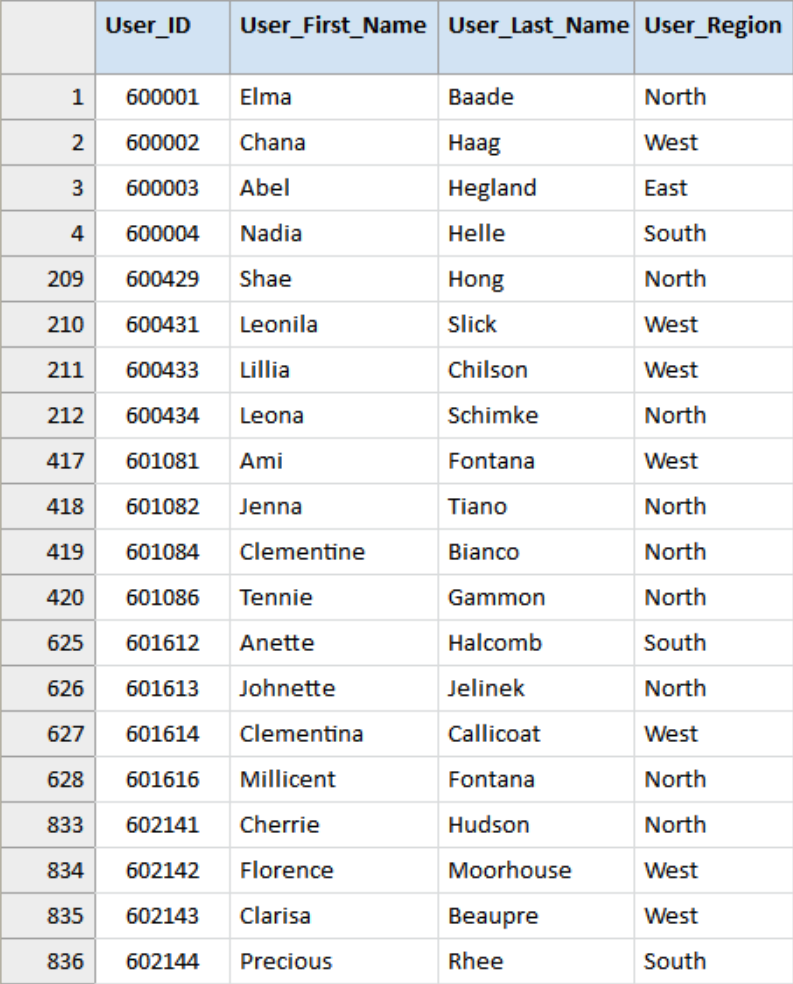
User_Accounts
The table User_Accounts includes the users’ IDs, first & last names and region (which might as well be department, country or a similar grouping). The names in this data set have been randomly generated. So, if any of these persons actually exist it would be pure coincidence. This example data file in this use case contains 1,290 records.
Regional_Managers
As you may have noticed, the User_Accounts data includes a region. Therefore, we also include a small reference table to document which manager is responsible for each of these regions. In the end, this information can be used to divide the results into smaller reports relevant for each of those managers. This example data file contains 5 records (4 regions and one overarching responsible manager).

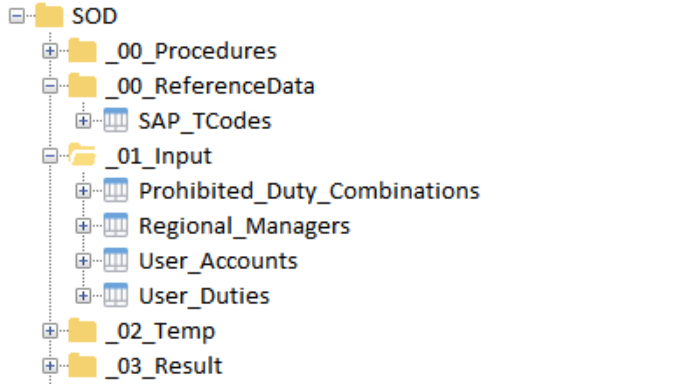
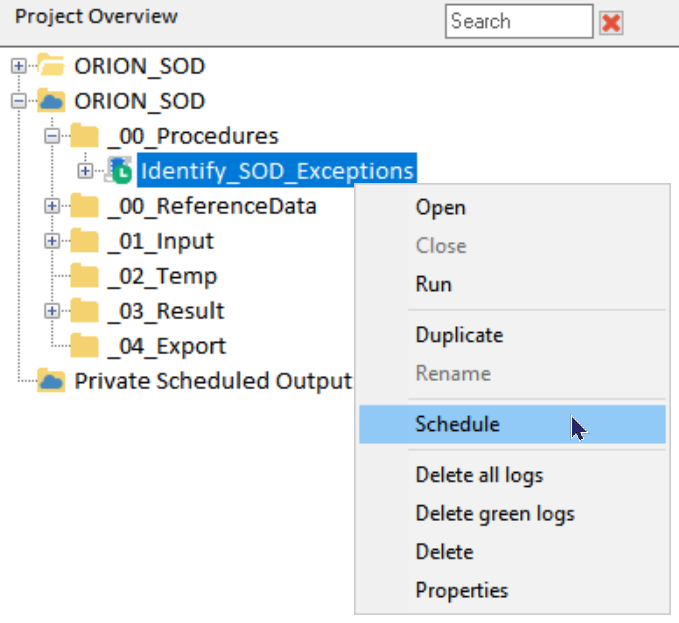
Project overview
All components we require to identify SoD issues such as tables (i.e. the data files), procedures, etc. are visible in the Project overview part in Arbutus Analyzer.
Acute observers may have remarked that data access or data import was not included in this user case. This is observation is of course correct. Although data import is very easy with Arbutus Analyzer, we decided to focus on the use case rather than the data access part. Please note, however, that Analyzer can access a vast array of data formats.
The data analysis process
Broadly speaking we can split this particular analysis into following steps:
- Verify the input files to make sure the data in those files is valid enough to perform further analysis.
- Prepare the input files to ensure they are good and ready to perform the actual analysis.
- Combine the user duties table with itself using a keyed many-to-many join to create a list of all permutations of duties/permissions assigned to an individual user ID.
- Compare the list of all permutations of duties (previous step) with the list of prohibited combinations to identify which combinations have been configured that must not be combined. So, here we basically create the exception list. As far as analysis goes, this could be the last step.
- Enrich the list of exceptions with master data (user names and managers) and reference data (meaning of the codes) to create a report ready for human consumption.
- Report or export the prepared view into a format that the interested parties can easily digest.
Note that the list above are the major steps and the actual analysis includes additional steps to prepare or clean tables before each of the main steps listed above can be performed. Without explaining all details, we will document each of these steps in the next couple of paragraphs.
Verify
One by one the data files should be checked for data errors. Data errors can occur for various reasons and the VERIFY command quickly checks whether the data is valid for the field (column) type.
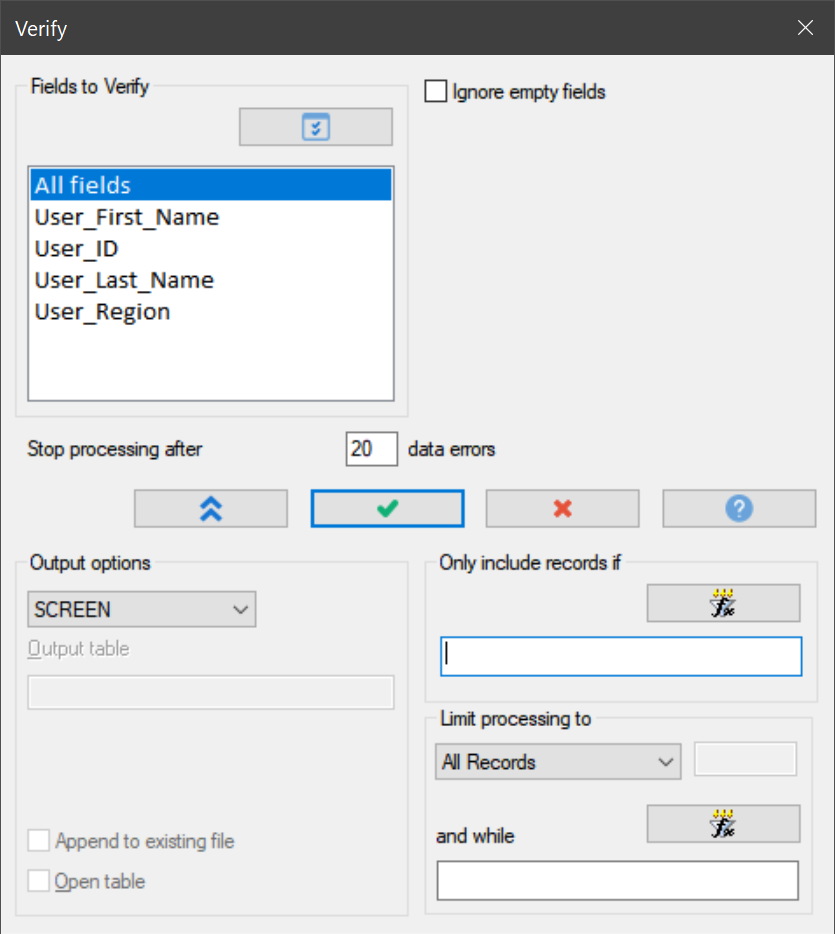
Further, more “logical” or “contextual” validations could be performed (typically using filters), such as:
- User_ID cannot be blank
- User_First_Name and User_Last_Name cannot be blank
- User_Region must be either “North”, “East”, “South”, or “West”
Prepare
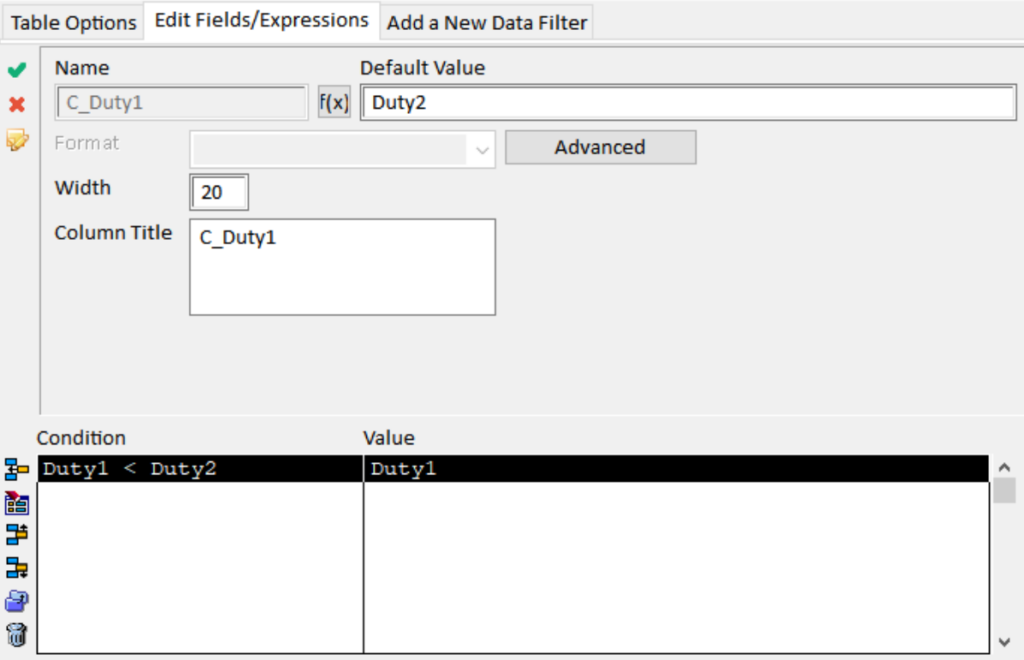
For this particular analysis, we need to prepare the Prohibited_Duty_Combinations table to make sure Duty1 is (alphabetically) before Duty2.
Why is this so? Well, suppose we have two codes that must not be combined (for example “drinking” and “driving”). It does not matter whether the combination is “drinking & driving”, or whether it is “driving & drinking”; the combination is not tolerated. However, we need to make sure we look for matches in a structured and efficient way; hence the alphabetical order.
Therefore, we are going to prepare the Prohibited_Duty_Combinations table so that we are sure Duty1 comes alphabetically before Duty 2. We do so without editing the source data. Instead we create conditional computed fields: C_Duty1 and C_Duty2.

Combine
The second aspect concerns the User_Duties file that contains all the duties (access) assigned to each of the User_IDs. We need to create a file that lists all permutations of the duties assigned to each individual User_ID. For this we use a JOIN command. In fact, this is one of the very few instances where we need to work with a “matched many-to-many join”. This is a powerful tool, but can potentially result in huge data files. In fact, such an unfiltered join of the original User_Duties file (42,370 records) would result in a table of 1,983,484 records!
To make this join process as efficient as possible, we first sort the User_Duties table creating two more files (basically clones of each other) so we can then join those two files more efficiently (without presort). In addition, we include a filter to only output records where DutyA < DutyB (similar to the explanation above).
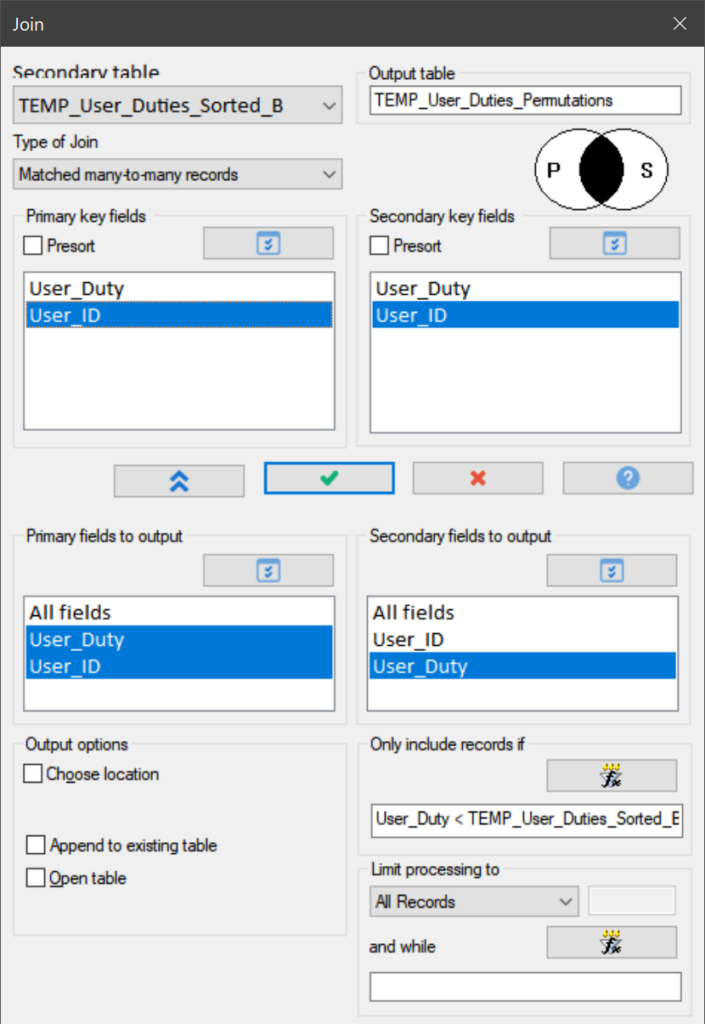
Even with this filter on (User_Duty < TEMP_User_Duties_Sorted_B.User_Duty), the join command still produces an output table of 970,404 records (in under half a minute we may add).
Compare
So now that all preparations have been completed, we can finally start answering the actual data analysis question. To reiterate, the question was: “Is our CRM system configured so that it completely enforces the SoD approach, or are users given too much access? Can we identify SoD issues in our systems?”
We answer this question by comparing the list of assigned duties per employee with the list of duties that must not be combined. To do this, we again use a JOIN command.
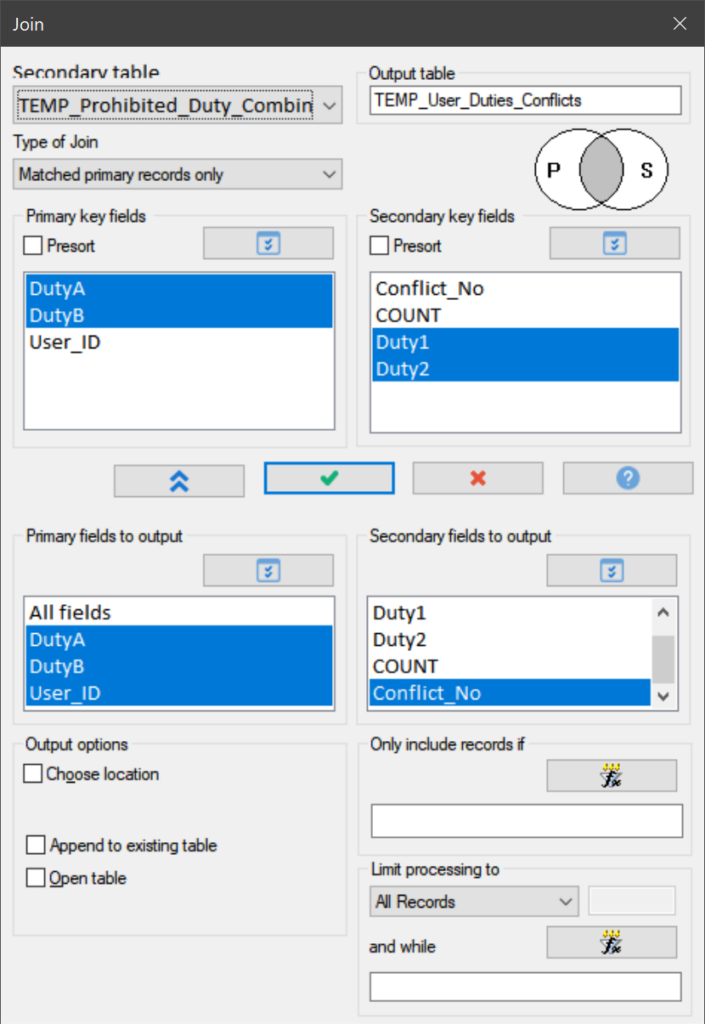
This join resulted in 856 records. That is to say, 856 configured duty combinations were identified that must not be combined in light of the SoD approach. For convenience this results table is sorted again by User_ID before final processing.
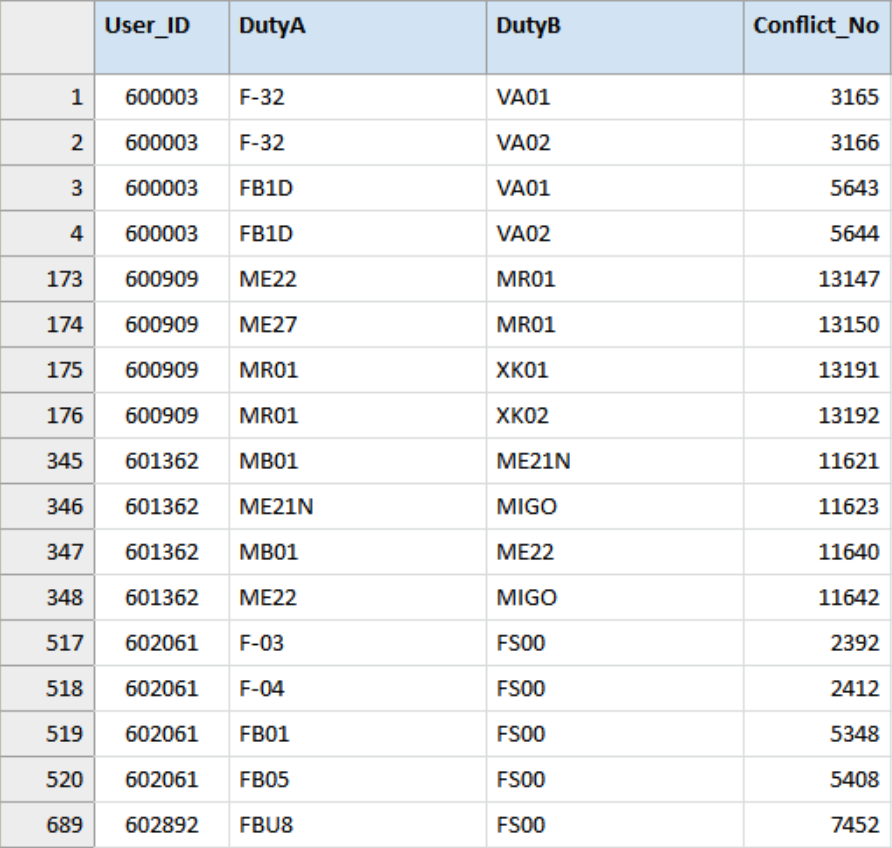
As you can see, this was the objective of the data analysis, but steps needed to be taken beforehand to be able to get to the answer and now more steps can be taken to make this answer even more informative and easier to process.
Spoiler alert:
We also found out that those 856 exceptions were linked to 140 users (out of the 1,290 records) or 10.8% of the analysed user accounts.
Enrich
In order to better understand the data, we would like to add the actual employee’s name as well as the responsible manager. This will allow us to distribute the report amongst those managers for immediate action. Also, we can enrich the output by adding a descriptive label to the duty codes (if that information is available).
To enrich a table with data from other tables we create relations between the tables as illustrated below. Afterwards, we simply add columns from those various tables into the same view.

In the view or report, we add all the fields of interest from the data table or related tables.

Report
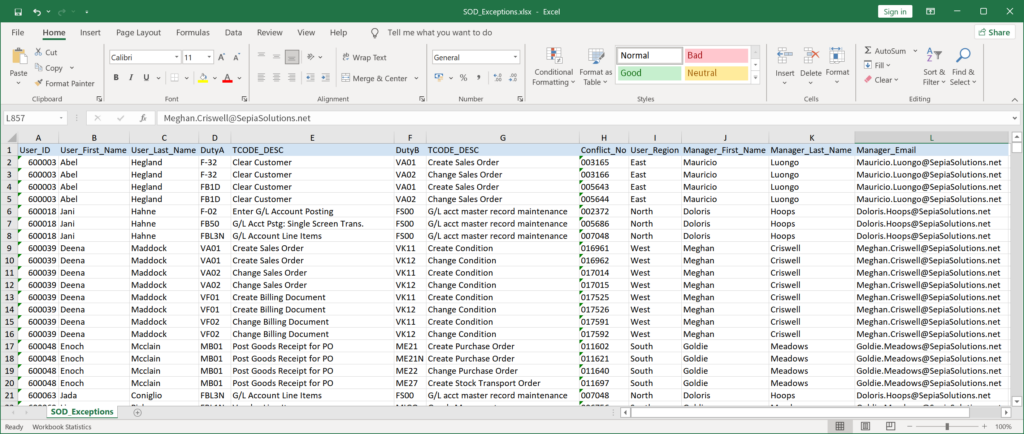
When enriched with data from the User_Accounts, Regional_Managers and the SAP_TCodes tables, a full report like this can be generated:

Most likely these anomalies or exceptions will be distributed or reviewed by different people (managers or experts). So, in order to make the information easily available, the data can be exported to other formats such as MS Excel.
This basically concludes the data analysis and provides us with the very detailed answer to our question.
Yet, things do note have to end here. Now that we have put all this effort into getting the data, working out an analysis and report it would be a shame not to get more return on this investment wouldn’t it? Let us discover how to increase the return on our intellectual investment …
Next step: increase ROI (return on investment)
Rerun same analysis
So, instead of just getting the answer once, we could copy all the commands that were logged automatically in the Command Log and turn this interactive analysis into a procedure we can easily run again and identify SoD issues in minutes.
The Command Log in Analyzer includes all executed commands and results.
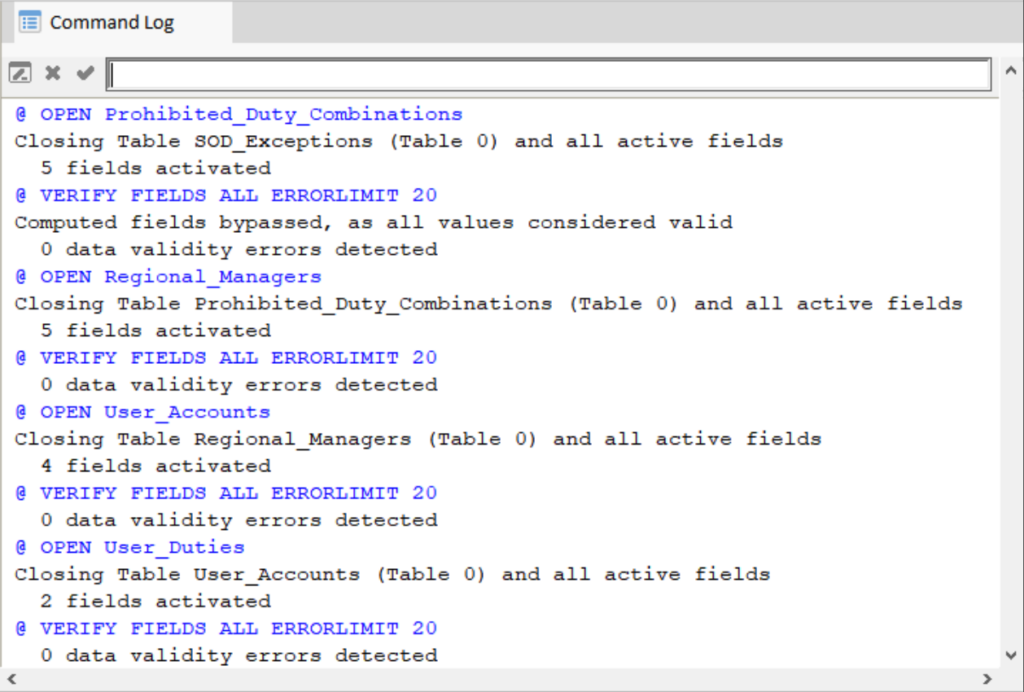
We can simply copy those commands and paste them into a procedure. The result of which may look something like the following illustration.

Once the procedure has been created and saved, it can be executed again and again without all the manual navigation through commands and parameters.
Automate and regularly schedule this analysis
But that is not all, the procedure could be scheduled via the Analyzer Hub so that it is automatically executed (for example every week or month). The scheduled procedure could even (if the necessary data is available) alert the managers responsible for the different departments so that immediate remedial action can be taken.

This automated procedure would in fact send out email alerts on a weekly basis to all regional managers. This email includes a list of SoD transgressions so that the manager can address them.

This alerting aspect closes the loop and may result in sizeable improvements to the overall process and avoid losses.
Actually, one of our clients set up such continuous monitoring (be it for other business processes) and was able to improve those processes and save the organisation over 4.1 million while doing so!
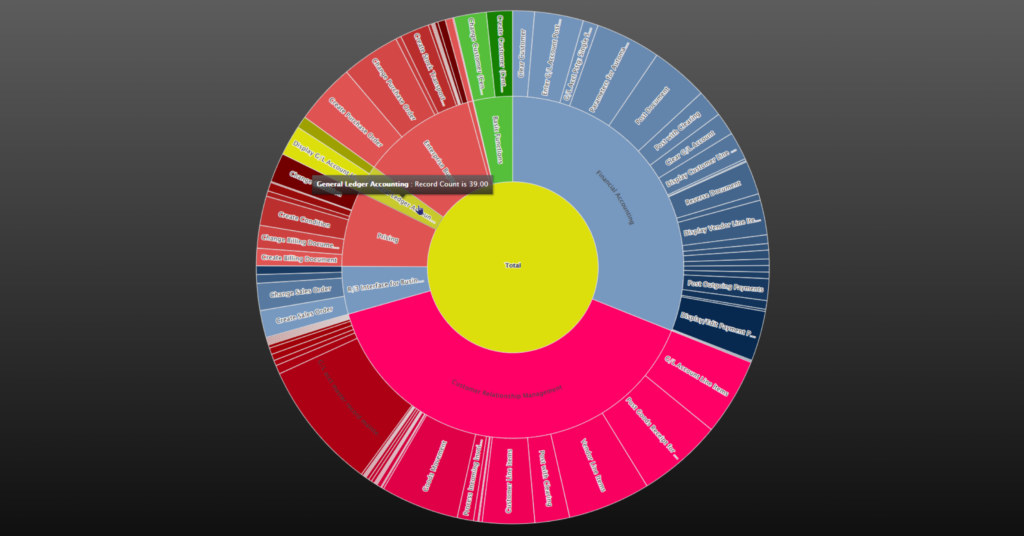
Are you wondering about the word cloud at the start of this use case? We create this graph based on the output of this analysis using the new graphing features in Analyzer version 7 just like the Sunburst graph below.