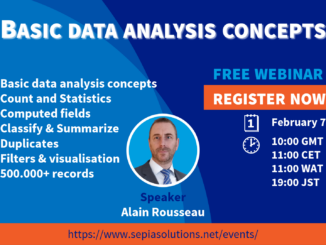
Develop your own basic fraud indicators
In light of the ACFE‘s annual International Fraud Awareness Week, we organise this free webinar to illustrate how you can develop your own basic fraud indicators with a data analytics platform such as Arbutus Analytics.
Once developed, you can run these analytics against your company data at regular intervals, alerting you via email of anomalies as defined in the analytics.
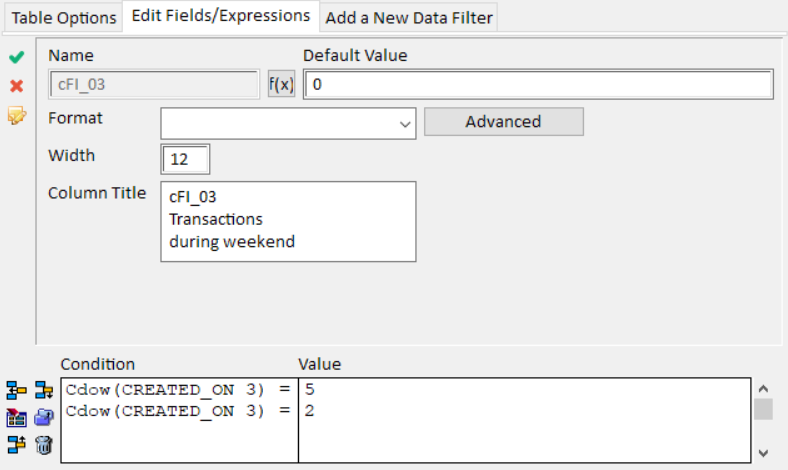
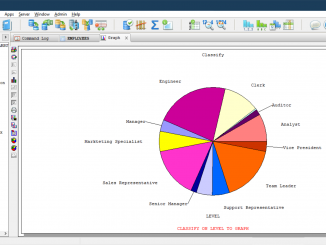
In this webinar, we illustrate how you can develop your own basic fraud indicators such as transactions with round amounts, or amounts just under approval limits, as well as transactions in the weekend, outside business hours, or on special days such as public holidays.
Note that in the webinar “Develop your own advanced fraud indicators“, we build more advanced fraud indicators such as outliers per vendor, infrequent or one-time vendors, trends in the amounts (per vendor), and if we have time even vendor dependency.
If you don’t already have the software, you can request an Arbutus Analyzer trial license to try it out.
Speakers

Alain Rousseau is the driving force behind Sepia Solutions. He has focussed on audit software tools since 2007 and implemented data analysis tools and audit management tools at dozens of organisations in different departments.
With a mixed background of technology and business, Alain is the ideal interface between business users and software developers. His in-depth understanding of both the software and audit profession also makes him an excellent trainer and consultant for these software packages.
Practical details
| Subject | Develop your own basic fraud indicators |
| Type of event | Webinar |
| When | Tuesday, November 7th 2023 11:00 – 12:00 CET (Brussels, Amsterdam, Paris, …) |
| Where | Online |
| What does it cost | This is a totally free webinar; no strings attached. Registration is mandatory. |
| CPE points | If you are a member of IIA Belgium and require CPE points, make sure to also register for this event on the IIABel website. |
Not the topic you’re looking for?
Is this topic too basic or advanced for you? Not to worry, check out our other events here.
Hopefully you’ll find an event that better fits your interests.
Missed the webinar, or does the timing not work for you?
First of all, make sure to follow Sepia Solutions on LinkedIn where new events are announced, or check our upcoming events regularly.
In addition, we typically either document the use case and/or make the recorded webinar available at a later date. Check out our list of use cases and recorded webinars.
You might be interested in other planned events:
-
Audit Software Watch Day 2024
Once again, Sepia Solutions will participate in the Audit Software Watch Day (2024 edition), organised by IIA Bel. […]