Develop your own advanced fraud indicators
In light of the ACFE‘s annual International Fraud Awareness Week, we organised this free webinar to illustrate how you can develop your own advanced fraud indicators with a data analytics platform such as Arbutus Analytics.
Once developed, you can run these analytics against your company data at regular intervals, alerting you via email of anomalies as defined in the analytics.
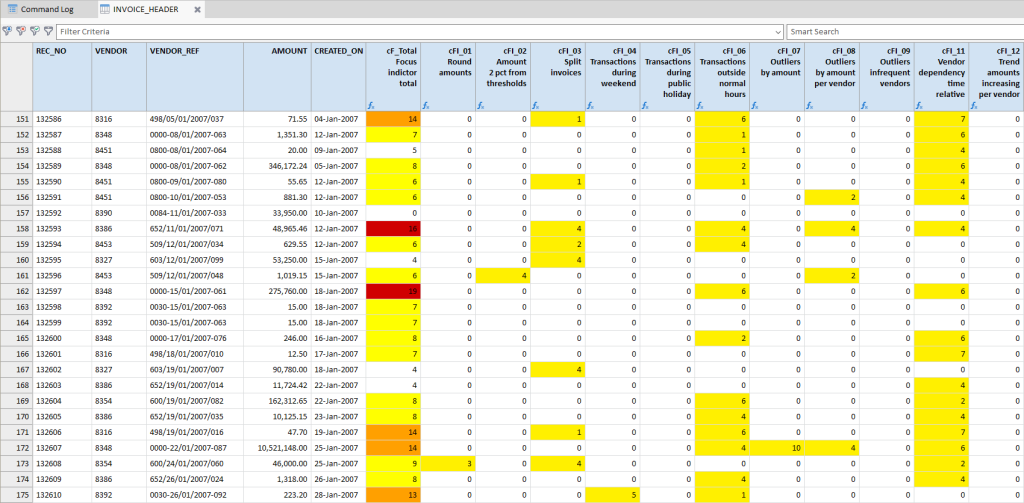
In this webinar, we illustrate how you can develop your own advanced fraud indicators such as outliers per vendor, infrequent or one-time vendors, trends in the amounts (per vendor), and if we have time even vendor dependency.
Note that in the webinar “Develop your own basic fraud indicators“, we work on a couple of simple yet effective indicators such as transactions with round amounts, or amounts just under approval limits, as well as transactions in the weekend, outside business hours, or on special days such as public holidays.
If you don’t already have the software, you can request an Arbutus Analyzer trial license to try it out.
Watch the full recording …
… or dive straight into the section of your choice …
Click on the links below to watch the video on the Sepia Solutions Youtube channel starting at that specific section.
Develop your own advanced fraud indicators – Shortcuts
Introduction and agenda for this webinar

We set the scene for this webinar, covering house rules and the topics for today. The main topics are: The business case, Which advanced fraud indicators to build, and how to build those indicators.
About me and Sepia Solutions

Of course, we cannot do without a one-minute personal introduction and introduction of the company and GRC software tools.
Webinars, past and future

A short overview of other webinars organised the same year. These and other past webinars are all all available as recordings.
Why use Arbutus Analytics?

Before we start building these indicators, let us explore why we use Arbutus Analyzer to do so. We consider the purpose for which the tool was built; how the main principles of the software align with data analysis; and explore the ecosystem of business partners, user community, helpdesk, local events, etc.
The business case
The fields in the data set (Transaction ID, Timestamp, Amount, and Identity) could be relevant to many different business processes such as accounts payable, accounts receivable, payroll, expenses, etc.

With over 2.5 million records, the data set reflects a real-life situation, not just 80 records of demo data.
Instead of using “dumb sampling”, the objective is to create a more intelligent way of zooming in on transactions of interest.
Last webinar’s basic fraud indicators

A short summary of the previous webinar in which we developed own basic fraud indicators such as transactions with round amounts, or amounts just under approval limits, as well as transactions in the weekend, outside business hours, or on special days such as public holidays.
All these basic indicators were based on individual records (unlike the indicators in this webinar).
What advanced fraud indicators?
In this webinar, we develop these advanced fraud indicators, using multi-record data analysis:
How to implement the indicators?
Now we can really get started building those focus indicators (or fraud indicators, or risk indicators as you may call them). The next sections of this webinar are mainly operations within the Arbutus Analyzer software; the slides only introduce the idea of the indicators.
Mind you, the point of these indicators is to identify trends or behaviour in the data that mean a deviation from the norm. But then, the norm, or what is normal within your data depends on your own business processes and circumstances. These examples are not necessarily applicable to you without adaptation but still illustrate the power of a data analysis tool.
FI_07: Missing transactions
Would you be able to spot 8 missing transactions out of the 2.5 million records? Well, good luck with that!
Arbutus Analyzer identifies these missing records in a couple of seconds.

FI_08: Duplicates
Based on only the TransactionID, we find no duplicates.
We also test for records with identical Amount, Identity, and Timestamp and many thousands. Is that normal? Well, that depends on your data environment.
Anyway, we Relate (link) the output table back to the source table to create the indicator.

FI_09: Outliers by amount
Using the average and standard deviation of the Amount field (per “Identity”), we calculate the (un)likelyhood of a transaction to be within the normal behaviour.
Transactions beyond the norm get a high risk score or fraud indicator.

FI_10: Infrequent business partners
The Summarize command we ran for the previous indicator is again useful for this one too. If the Count (number of transactions for an Identity) equals 1, then we only have one transaction for this identity, making it an infrequent business partner (perhaps a one-time vendor, or the like).

FI_11: Always same amount per identity
Always the same Amount for an Identity. Whether that is normal or not, depends on the business case.
Either way, the same Summarize command from before, the calculated Count and Standard Deviation per Identity will show us whether the Amount varies for an Identity or not.

FI_12: Always increasing amount for identity
This indicator flags Identities (possibly a vendor or employee), for which the Amount in the transactions always increases and never decreases over time. If looking for a pattern in fraud, it is quite common behaviour to always go for a bigger payout.

FI_total, the Log, and runing a procedure
Arbutus Analyzer automtically logs all the data analysis commands we ran, creating these focus or fraud indicators. This Command Log (audit log) can now be turned into a Procedure.
This procedure can be run again and again on the same or newer data set, outputting the results in a matter of minutes. In this example, we sprused up the Procedure some to also create the Triggers (conditional formatting).
Isn’t that a great return on your investment of investigation, thinking and analysis?

Next steps
How can we help you, achieve your own data analysis objectives?

Well, reach out and we’ll schedule a first meeting, possibly followed-up with a practical workshop.
If we find there is a good match, we can proceed with a full and personalised implementation. of Arbutus Analytics platform.
Q&A and closing

A short recap of this session.
Also a repeat of our question to you: Which topics would you like to see addressed in one of our next webinars?
Reach out to us right now
You might be interested in other planned events:
Sorry, no more events are currently planned (or we haven’t updated our website).
Feel free to reach out to us, or check again later.