Expand your data analysis toolkit with Arbutus SmartApps
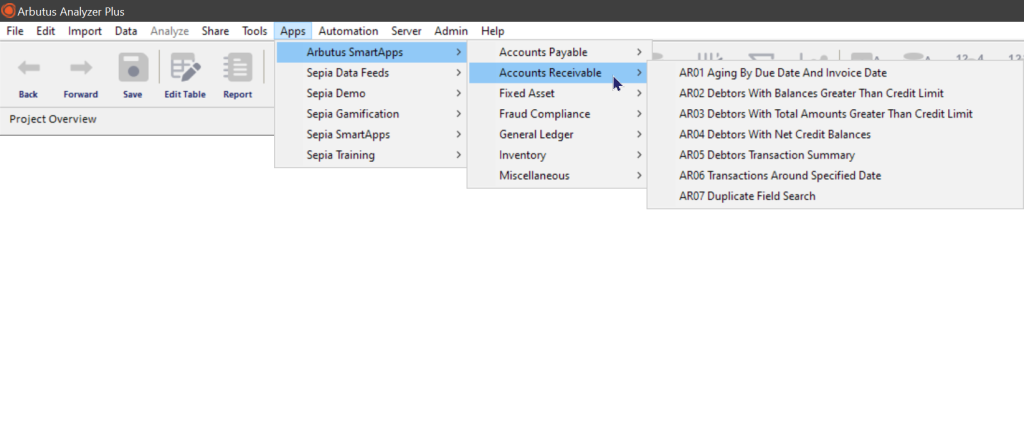
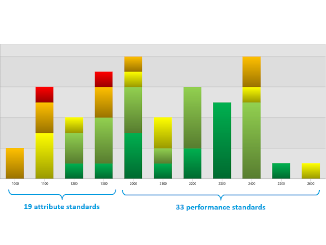
The Arbutus SmartApps are a collection of about 70 predefined audit analytics for areas such as accounts payable, accounts receivable, inventory, compliance, etc. So why would you want to build your own Arbutus SmartApps?
Flexible and versatile as the data analysis tool “Arbutus Analyzer” is, there are still things it doesn’t do that you might wish were included.
Well, adding your own SmartApps is not that hard and may really save time for you and your colleagues. So, become the expert and create added value for your team!
In this short webinar, we illustrate all the steps of creating a SmartApp from scratch and sharing it with your colleagues so that it appears a seamless new feature in Analyzer.
You can follow this analysis along, or try this out yourself later as we will post the procedure for the SmartApp (i.e. executable script) on this website.
If you don’t already have the software, you can request an Arbutus Analyzer trial license to try it out.
Speakers

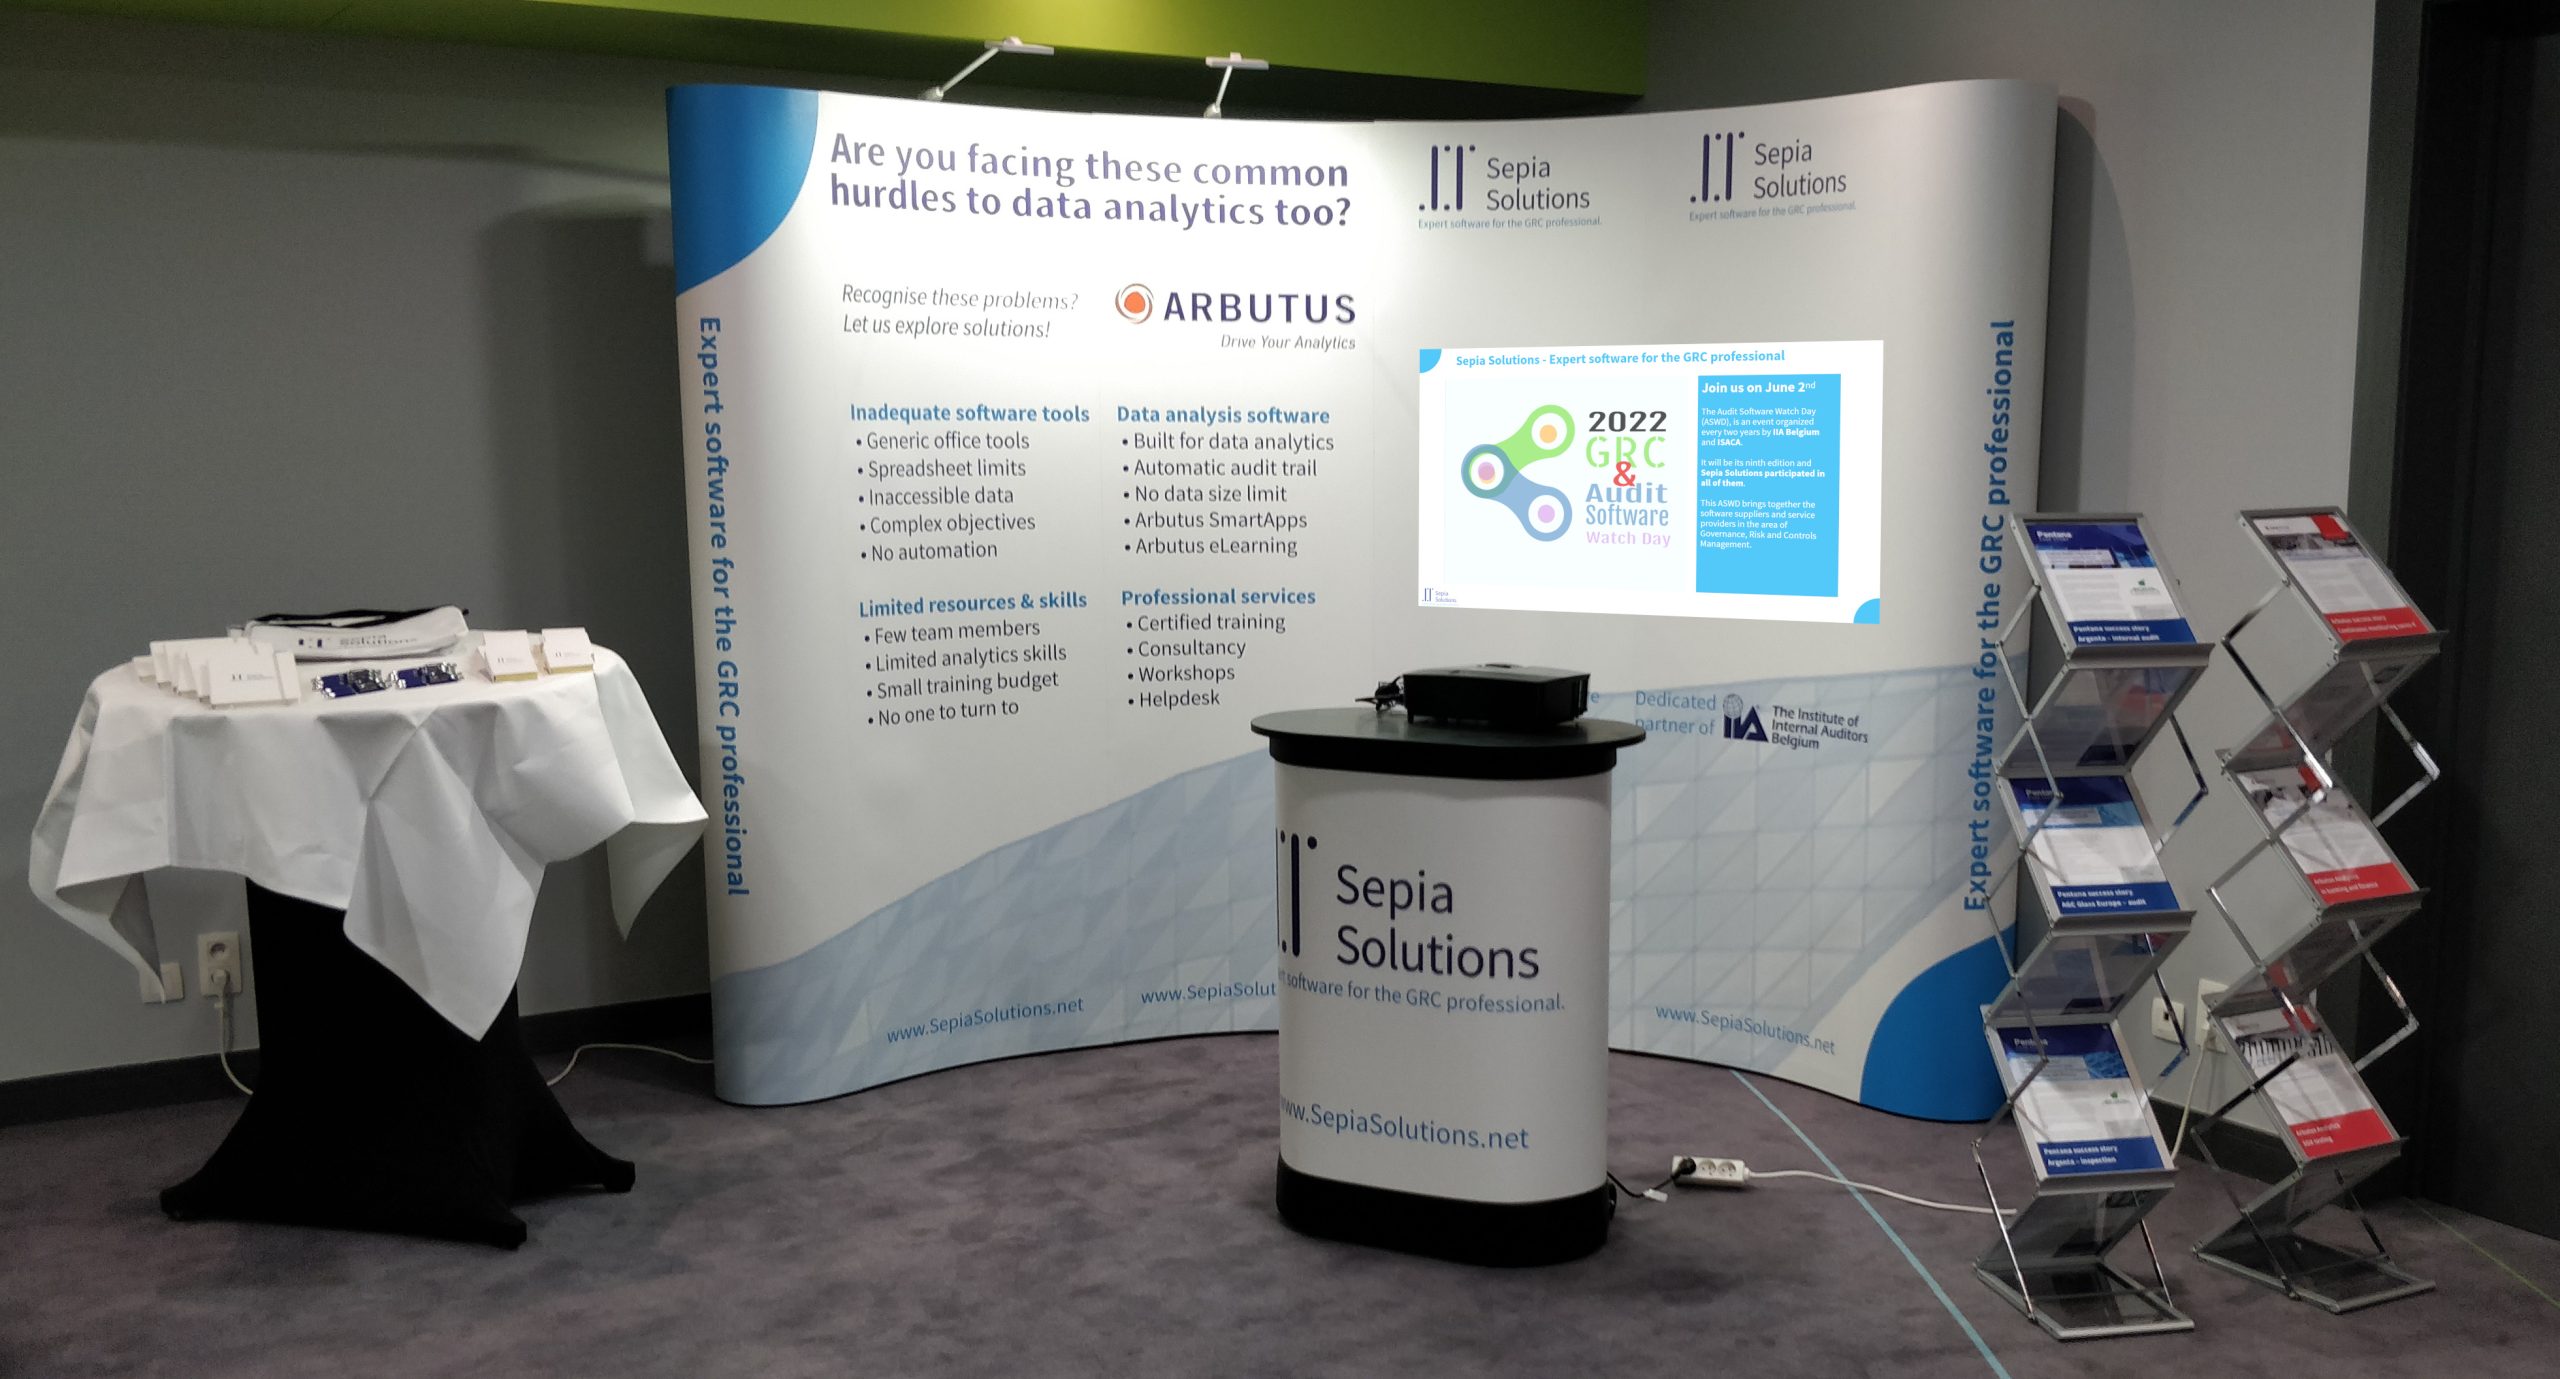
Alain Rousseau is the driving force behind Sepia Solutions. He has focussed on audit software tools since 2007 and implemented data analysis tools and audit management tools at dozens of organisations in different departments.
With a mixed background of technology and business, Alain is the ideal interface between business users and software developers. His in-depth understanding of both the software and audit profession also makes him an excellent trainer and consultant for these software packages.
Practical details
| Subject | Expand your data analyis toolkit with Arbutus SmartApps |
| Type of event | Webinar |
| When | Tuesday, May 16th 2023 11:00 – 12:00 CET (Brussels, Amsterdam, Paris, …) |
| Where | Online |
| What does it cost | This is a totally free webinar; no strings attached. Registration is mandatory. |
| CPE points | If you are a member of IIA Belgium and require CPE points, make sure to also register for this event on the IIABel website. |
Not the topic you’re looking for?
Is this topic too basic or advanced for you? Not to worry, check out our other events here.
Hopefully you’ll find an event that better fits your interests.
Missed the webinar, or does the timing not work for you?
First of all, make sure to follow Sepia Solutions on LinkedIn where new events are announced, or check our upcoming events regularly.
In addition, we typically either document the use case and/or make the recorded webinar available at a later date. Check out our list of use cases and recorded webinars.
You might be interested in other planned events:
-
Audit Software Watch Day 2024
Once again, Sepia Solutions will participate in the Audit Software Watch Day (2024 edition), organised by IIA Bel. […]